DOI: 10.14714/CP94.1504
© by the author(s). This work is licensed under the Creative Commons Attribution-NonCommercial-NoDerivatives 4.0 International License. To view a copy of this license, visit http://creativecommons.org/licenses/by-nc-nd/4.0.
Designing an Experience: Maps and Signage at the Archaeological Site of Ancient Troy
Chelsea Nestel, University of Wisconsin–Madison | nestel@wisc.edu
Maps and signage are essential for visitors to understand and appreciate the cultural, historical, and natural importance of a heritage site. Unfortunately, the on-site maps and signage at the archaeological site of ancient Troy near Çanakkale, Turkey, create a poor visitor experience. A UNESCO report found that the site suffered from “poor and confusing wayfinding” and “visual clutter and chaos” (Riorden 2009, 9–10). To understand how the maps and signage failed to help visitors, I completed a content analysis of the maps and signage found at Troy in the summer of 2014, based on recommendations from cartographic semiotics and the field of experiential graphic design. The analysis uses a case study of the archaeological site of Ancient Troy to derive insights into user experience design at preserved sites of cultural or historical significance.
KEYWORDS: experiential graphic design; semiotics; signage; archaeology; wayfinding; environmental graphic design; information design; historical site; maps; cultural heritage
FROM “GREAT EXPECTATIONS” TO “GREAT DISAPPOINTMENT”: WHY SIGNAGE SYSTEMS MATTER
When we arrive at a historic site, how do we understand what we see? Maps can do much of the heavy lifting of explaining the environment, but rarely do so on their own. Frequently, wayfinding systems comprising installed signs (described as signage) and maps (both portable and installed) help travelers understand where they are and what is around them. A growing industry, experiential graphic design (XGD; formerly known as environmental graphic design), exists to manage the experience of place through signage systems. However, relatively minimal attention has been paid in cartographic research as to how signage and maps interact with each other in a well-functioning wayfinding system.
Historic sites present a special wayfinding design challenge because visitors arrive with preconceptions of what they are about to see. Media consumed before the trip build an imaginary idea of what the place will be like (Urry and Larson 2011) and set expectations for the visit (Skinner and Theodossopoulos 2011). On site, tourists become “semioticians” of the landscape, looking for classic “signs” that “signify” the identity of the place (Culler 1981). For example, the Eiffel Tower signifies the identity of Paris, France. When the place itself is highly complex, such as an archaeological site with overlapping strata, the wayfinding system is relied upon to help the visitor find these “signs.” If the wayfinding system is unable to translate the environment for the visitor, the result is a disappointing visitor experience. For historic sites, which often rely on the public for their funding, a good visitor experience is critical to the site’s popularity and continued preservation.
My research examines the wayfinding system used at ancient Troy, an archaeological site laden with visitors’ expectations, and featuring a poorly functioning signage system that has contributed to negative visitor experiences. I conducted a quantitative content analysis of the maps and signage available on-site in 2014 using research and recommendations from cartographic semiotics and XGD. Both cartography and XGD are focused on depicting places; joining them creates an approach that combines a scientific, semiotic understanding of how maps work (cartography) with practical knowledge of signage and wayfinding best practices (XGD). To date there has been little cross-pollination between the fields, despite their significant potential to enrich each other through shared interests in maps and wayfinding. The XGD field is expanding and presents an opportunity for cartographers to contribute their ideas and insights on the design and function of maps in the environment.
Herein, I discuss how the signage system at ancient Troy fails to meet the current best practices of XGD, and I set forth guidelines for improving wayfinding signage at Troy that would also apply to other historic sites.
SIGNED IS NOT DESIGNED: THE EXPERIENCE OF TROY
“As ruins go, this site is seriously ruined.”
“I was hoping for the movie story. . . so I guess the bar was waaaay too high!”
“The horse at Çanakkale is more authentic.”
Quotes on TripAdvisor (n.d.) from tourists without a tour guide
Many tourists report that their experience at Troy is a disappointment. A number of factors contribute to this negative perception. First, many of the visit Troy after having seen the better preserved ruins of Pompeii or Herculaneum, or the reconstructed monuments of Ephesus. Second, because of Troy’s complex history and its sheer size, it is difficult for tourists to navigate and understand what they are seeing without informative guides. During its 3,500-year history, Troy was destroyed multiple times due to war and earthquakes, resulting in successive layers of ruins that are difficult for tourists to read within the landscape. Third, the on-site maps and signage at Troy have been designed in an inconsistent and ad hoc manner, resulting in Troy’s two greatest challenges, according to UNESCO: “poor and confusing wayfinding” and “visual clutter and chaos” (Riorden 2009). The tourist path is poorly marked with wayfinding signage, causing visitors to miss important structures or vistas. Due to constraints imposed by the Turkish Ministry of Culture, existing signage has an inverted hierarchy: caution signage (such as that which forbids smoking or offers other warnings) is emphasized over directional and informational signage. Most visitors arrive by bus and are on site for only 90 to 120 minutes, making the lack of efficient wayfinding and concise informational signage particularly problematic under the tight time constraints.
Finally, the maps and signage provided do not meet the standards of good cartographic design and XGD. The mapping and color conventions used in the signage are derived from maps featured in archaeologist Wilhelm Dörpfeld’s 1902 book Troja und Ilion. These standards violate contemporary cartographic design conventions by using color hue to depict quantitative information (Figure 1). The current signage was developed by archaeologists and stakeholders managing on-site research during the period of 1988–2012 (William Aylward, pers. comm., 2014). This group was trained in neither cartography nor XGD, and is not involved with managing Troy today.
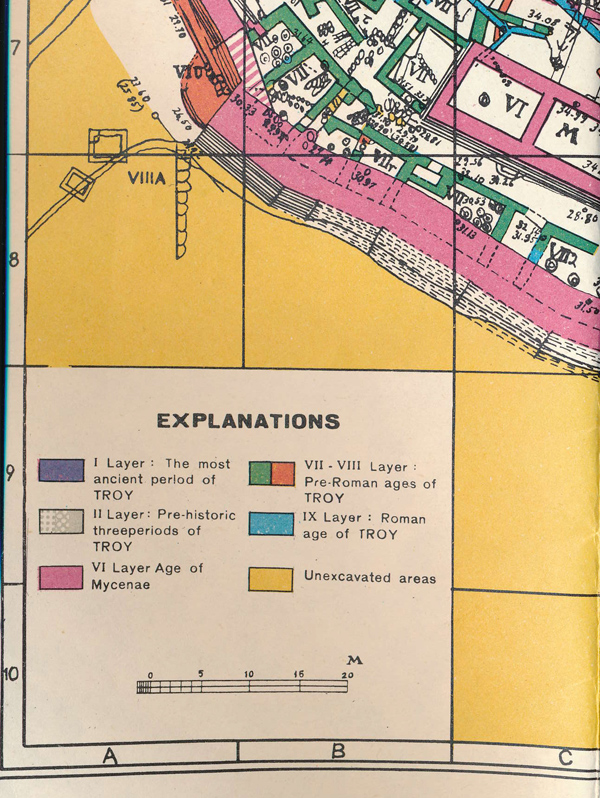
Figure 1. Legend from Wilhelm Dörpfeld’s (1902) map of Troy, from which color conventions were derived for the site’s signage. The layers have been organized chronologically but represented with a qualitative color scheme. The cartographic solution is to assign a sequential color scheme.
CONSULTING THE ANCIENT TEXTS: A LITERATURE REVIEW
SEMIOTICS
I draw from two bodies of knowledge to inform my analysis of Troy’s wayfinding system: cartographic semiotics and experiential graphic design. Beginning with the first, modern semiotics is influenced by two dominant models of signs: dyadic (developed by Ferdinand Saussure between 1907 and 1911) and triadic (proposed by Charles Sanders Peirce in 1867; Hoopes 1991; Nöth 1990). Saussure’s dyadic model consists of a representation (signifier) such as the letter “H” on the map, and a concept (signified), which could be “Hospital” on some maps, or “Helicopter” on others. The ambiguous meaning in this example indicates the importance of carefully considering real-world context in the design of maps and signage. Peirce’s triadic model of the sign includes (using Morris’s 1938 terminology) the sign vehicle (equivalent to Saussure’s signifier) and the interpretant (equivalent to Saussure’s signified), while adding the referent, or the real-world object or phenomenon (Figure 2). The same “H” map mark, using the triadic model, consists of (i) representation—the letter “H” on the map, (ii) the concept of “Hospital” or “Helicopter,” and (iii) the real-life object to which the sign refers—the actual hospital or helicopter pad. The advantage of the triadic model over the dyadic model is that the former allows for additional consideration of the real-world phenomenon—the referent—which is the primary visual signal and point of confusion. The ruins of an archaeological site like Troy are difficult for visitors to comprehend because they’re mostly no longer present and therefore do not visually match up to the sign vehicles or interpretants used in on-site signage, which are usually of more complete structures. The referent, while always relevant to design, is particularly important when looking at wayfinding systems and the interplay of maps and signage.
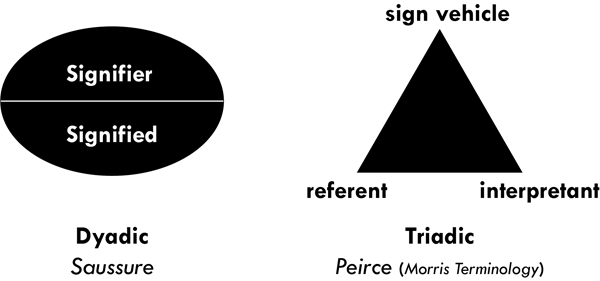
Figure 2. Dyadic and triadic sign systems. The dyadic system consists of the signifier (the symbol) and the signified (the concept). The triadic system adds the referent, or real-world object or phenomenon.
Ogden and Richards (1923) visualized Peirce’s triadic model in a triangle to put the emphasis on the interpretant’s mediation of the sign vehicle and referent (Figure 3), but each axis of the semiotic triangle can mediate “between what is seen and what is known” (MacEachren 1995, 221). Thus, “spinning” this semiotic triangle provides different ways of looking at the interplay among the referent, interpretant, and sign vehicle, resulting in three different dimensions for assessing the maps and signage at Troy. A referent-as-mediator approach acknowledges that there are many kinds of representations possible for a given real-world object and that congruence should be maintained between characteristics in the design of the sign vehicle and the referent the sign describes. An intepretant-as-mediator approach acknowledges that a sign serves as shared knowledge between the designer and the visitor. Finally, a sign-vehicle-as-mediator approach acknowledges the sign vehicle as the connection between the real-life object and its meaning. Using each axis as mediator allows for a multifaceted examination of how maps and signs generate meaning using different visual variables or other design dimensions. Each of these three semiotic approaches was the basis for a portion of my analysis of the design of maps and graphics at Troy.
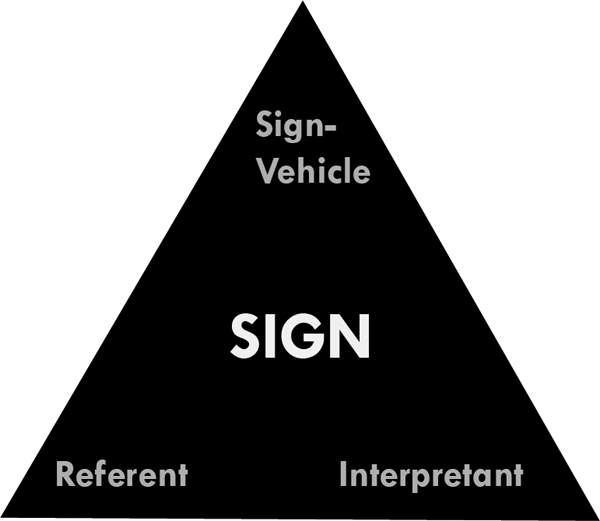
Figure 3. Ogden-Richards Triangle. “Spinning the triangle” shows different aspects of semiosis: sign-vehicle-as-mediator focuses on the connection between a real-life object and its meaning. A referent-as-mediator approach focuses on the different kinds of possible representations and emphasizes congruence between characteristics for the design and referent. An interpretant-as-mediator approach focuses on shared knowledge between the designer and visitor.
From the referent-as-mediator perspective, we can examine the type of information and embedded knowledge about the referent that is contained in the representation. Below, I analyzed the information content that can be found in wayfinding systems at Troy, placing that content into three categories following geographic information theory (Peuquet 1994): attribute information, geographic information, and temporal information. Archaeological sites are unique in their emphasis of temporal, or historical information, which puts events and artifacts in historical context.
I also examined the embedded knowledge content of the signs. Embedded knowledge is expert knowledge that enhances the interpretation of the sign vehicle and surrounding environment. Three forms of embedded knowledge have been formalized by research on spatial cognition (Golledge and Stimson 1987, 94): declarative knowledge that organizes information about phenomena with their meanings, procedural knowledge that organizes information about how to complete a task or move from place to place, and configural knowledge that organizes information about the spatial arrangements of objects. Although declarative and procedural knowledge are helpful for wayfinding, configural knowledge draws declarative and procedural knowledge together to help form a knowledge of place. An example of configural knowledge at Troy is the spatial layout of ruins at a vista.
The interpretant-as-mediator perspective focuses on the ambiguity in the sign, and typically is treated in cartography as the degree of arbitrariness in the representation. Most signs fall on a continuum somewhere between abstract and iconic (MacEachren and Ganter 1990). To further classify the iconicity of signs I used the Robinson taxonomy, which classifies symbols as pictorial, geometric, and associative (Robinson et al. 2005). The Robinson taxonomy does not account for the realism now possible beyond pictorial representations; I have appended a category to account for this.
Many commonly encountered symbols in maps and signage are part of sign libraries. Two of the most common sign libraries used at cultural heritage sites are the AIGA /DOT symbol library developed by the American Institute for Graphic Arts in collaboration with the US Department of Transportation (AIGA, n.d.), and the ISO 7001 (International Standards Organization) symbol library for depicting information in public areas (ISO 2007). Because these symbols are widely used, they have a greater potential to be recognized by visitors and thus limit confusion while promoting wayfinding.
The sign-vehicle-as-mediator approach evaluates the use of visual variables, the perceptual dimensions that can be varied to encode information in the sign, according to their effectiveness for depicting information at a given level of measurement (Bertin 2010; MacEachren 1995). The sign-vehicle-as-mediator approach also applies to the text in the wayfinding system, as the visual characteristics of text can also be designed to encode meaning.
EXPERIENTIAL GRAPHIC DESIGN
In addition to semiotics, my analysis of Troy’s wayfinding systems draws upon ideas from experiential graphic design. In XGD, signage in the environment is frequently classified by function, e.g., road warning signage (Smitshuijzen 2007). Sign designers generally list six overarching sign types (Mollerup 2013; Katz 2012; Gibson 2009; Smitshuijzen 2007): (i) identification, (ii) directional, (iii) informational, (iv) regulation, (v) ad-hoc, and (vi) indirect (Table 1). Signage can also support multiple functions at one time, such as an identification sign that also provides directions (Figure 4). Identification signage, in particular, is important at Troy because the features of the ruins are not easy to identify in the landscape (e.g., compare the library of Celsus at Ephesus to the Sanctuary at Troy; Figure 5). Signage needs to communicate that the vistas “are indeed extraordinary, even though [they do] not seem to be so” (Urry and Larson 2011, 16).
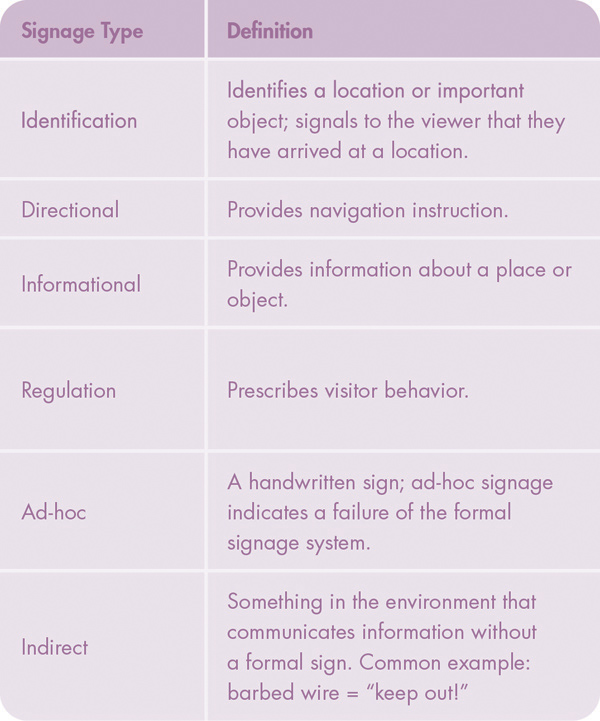
Table 1. Signage classification types.
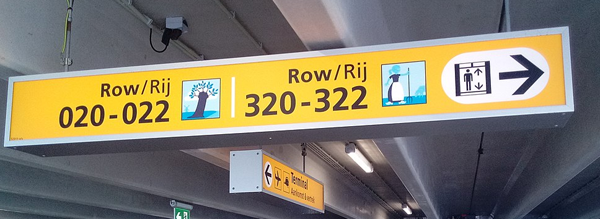
Figure 4. An example of a sign that supports multiple functions at once. This sign is an identification sign (you are at Row 020-022) and a directional sign (elevators are to the right). Photo by Donald Trung Quoc Don, 2019 (CC-BY-SA). bit.ly/3aqe12K.
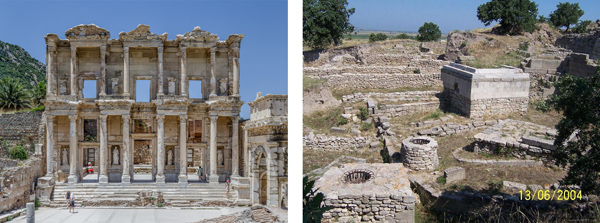
Figure 5. The library of Celsus at Ephesus (left) and the Sanctuary at Troy (right). Although both sites would benefit from the inclusion of identification signage, the scene on the right would benefit the most. Left: Photo by Behn Lieu Song, 2010. bit.ly/39kmQLn. Right: Photo by Jennifer Tanabe, 2006. bit.ly/2vDNm3s.
Signs can also be classified by their shapes. Variation in shape can reflect the function that the sign serves. Certain shapes are commonly used for signs, primarily derived from road signage. Circular signage typically provides instruction or regulation; rectangular signage, including square signage, identifies or provides directions; triangular or diamond-shaped signage serves as a warning (Federal Highway Administration 2012; UNECE 2006).
Signage and maps installed outdoors are often affected by environmental conditions, and I considered some of these factors in my analysis. Lighting can drastically change the legibility of a sign, and its effect is mediated by the finish used on the sign. A glossy surface will reflect direct sunlight, while a semi-matte or matte surface will reflect less light (Mollerup 2013; Calori 2007). Furthermore, while a sign may be well-designed, its physical placement in the environment can decrease its effectiveness. Like the concept of the visual hierarchy in cartography—that the most important information should be the most prominent in a map’s design—the sign hierarchy necessitates that the most important signage be the easiest to discern in the environment (Mollerup 2013). Signage that violates this rule cause confusion.
Sign systems can include wayfinding enhancements to assist visitors in navigation. Readers experience a lower cognitive load when interpreting maps or sign systems that follow certain naming conventions. Place names should include procedural directions (Mollerup 2013), and names should be the same between maps and signage, because synonyms for place names (e.g., “Main Street” versus “Downtown”) can cause confusion (Mollerup 2013; Calori 2007; Smitshuijzen 2007; Arthur and Passini 1992). Abbreviated place names can be easier for visitors—especially if using an abbreviation will help avoid a hyphenation—but should not replace descriptive place names (Mollerup 2013).
Lastly, there are a number of wayfinding considerations affecting the design of maps. Designers should consider the direction that the visitor will be facing when making a map for installation in the environment, instead of always using the traditional “north-up” alignment of paper maps. A “heads up” display that orients the map in the direction that the visitor is facing does not require mental rotation to understand the environment (Katz 2012). Occasionally a designer may choose to distort distance or geography in the interest of simplicity, such as in a schematic map of a subway. On map installations, the You-Are-Here mark is used with an arrow indicating the direction that the person is facing rather than a dot that does not inform the visitor of their orientation (Katz 2012). The entirety of the sign system should follow common patterns to speed up visitors’ processing of information.
Taken together, insights from cartographic semiotics and XGD provide a basis for the design of wayfinding systems, and thus critical assessment of existing wayfinding solutions, toward the end of improving the visitor experience. Next, I apply these reviewed guidelines through a quantitative content analysis of maps and signage at Troy.
HOW TO READ THE “SIGNS”: METHODS
Quantitative content analysis (QCA) describes the process of generating quantitative information from a sample by counting and comparing different qualities of the artifacts studied (Muehlenhaus 2011a). The requirements of QCA are (1) a sample of artifacts and (2) predetermined codes that can be applied to an artifact. The codes represent an artifact’s traits; if the artifact is a map, for example, those traits could be the use of color, or the presence of a north arrow. The traits themselves can be qualitative, quantitative, or even a Likert-scale rating (Kessler and Slocum 2011). Each trait can be considered a dimension of an artifact, and each artifact receives a binary code that indicates whether it possesses that trait or not. Traits need not be mutually exclusive. Variations of QCA have been used in cartography to study journalistic mapping (Monmonier 1989), persuasive maps (Muehlenhaus 2011a; 2011b), web mapping technologies (Roth et al. 2014), and journal publications (Kessler and Slocum 2011).
The general advantages of QCA include the speed of analysis (compared to qualitative content analysis) and the ability to compare many traits over time across a large sample. The inherent subjectivity of qualitative work often means that researchers cannot build on previous analyses, but in QCA, a future researcher could pick up the codes and replicate previous work (Muehlenhaus 2011a). QCA offered other advantages for this study, specifically: it enabled data collection without requiring a research visa, as would be necessary for other kinds of analysis that require access to non-tourist areas of the site (e.g., redesigning the tourist path to better view archaeological features). QCA also allowed me to derive a list of specific ways that maps and signage at Troy were not functioning well from a single analysis. Finally, QCA was cost-effective, as it could be conducted on the basis of photographs of maps and signage, which were free to take.
In this analysis, common design pitfalls are flagged by a selection of codes representing best practices derived from cartographic scholarship and XGD. The coding scheme was particularly useful for understanding how Troy’s signage system could be improved, because “violations” of conventional mapping recommendations (e.g., using color hue to represent quantitative information) revealed specific design shortcomings. Generally, a single instance of ineffective design was enough to suggest that a sign be redesigned, because the codes represented significant design limitations, as determined by prior research in cartography and XGD. Furthermore, because the sample consisted of a signage system designed using common rules, an ineffective design on one sign was commonly repeated on other signs of that type. For example, illogical numbering found on one identification sign was found on most other identification signs as well. Thus, a single ineffective design decision could have compounding effects. In addition to signage violating cartographic standards, I also noted underutilization or total absence of design elements whose use is considered best practice in cartography and XGD (e.g., using a heads-up map orientation). Thus, the results of the QCA identified specific ways that individual signs, and the sign system itself, could fail the viewer.
To conduct my analysis, I collected geocoded images of signage at the Troy site from July 15th to July 16th, 2014 creating a census of every sign a visitor could encounter while on the tourist path. Images were excluded from the analysis if they were duplicates, blurry, contained an unusual lighting condition, were not a permanent installation, or were outside the bounds of the site. After this filtering, 108 total artifacts remained for the quantitative content analysis. Of those, 86 artifacts were signage without maps and 22 were signage with maps.
60 unique codes were applied to each artifact (Tables 2–5). The codes were grouped into categories. The first three were derived from the spinning of the Odgens-Richard Triangle: referent-as-mediator, interpretant-as-mediator, and sign-vehicle-as-mediator. Recommendations from XGD were included in a fourth category. The codes were binary—either an artifact received the code or it did not—but the codes were not mutually exclusive, so artifacts could receive multiple codes from the same category. The final coding scheme enabled an analysis of how the maps and signage functioned across broad semiotic categories through spinning the Ogden-Richards Triangle, and by individual semiotic codes. Inferential statistics were not included because the sample size was low and did not include a control group. However, a researcher could collect another sample in a few years to note improvements. The final result was a table of design imperatives, organized by code categories, which includes recommendations for all signage, as well as for specific types of signage (e.g., directional signs; see Table 6).
IMPROVING THE TOURIST GAZE: RESULTS AND RECOMMENDATIONS
I analyzed and interpreted the results using the code themes for the referent-as-mediator, interpretant-as-mediator, sign-vehicle-as-mediator, and XGD perspectives. Some codes are omitted from discussion because the results were not directly relevant to this analysis, such as sign type.
REFERENT-AS-MEDIATOR
INFORMATION CONTENT
Geographic information (56.5%) was found on more than half the signs. But, only 22 of 108 on-site signs (20.4%) included geographic information in the form of maps (Table 2, IC3 & K3). Geographic information was found on many examples of directional signage in the form of spatial navigation procedures indicating the direction to a particular layer of the site (Figure 6), but such directional signage was text-based and included no map visuals. An opportunity was thereby missed to pair identification and directional signage with maps, which would provide both procedural and configural knowledge within a single sign.
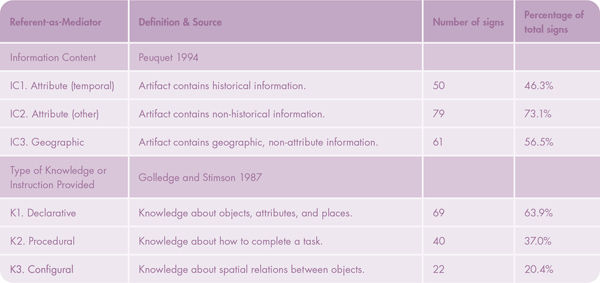
Table 2. Referent-as-Mediator results.
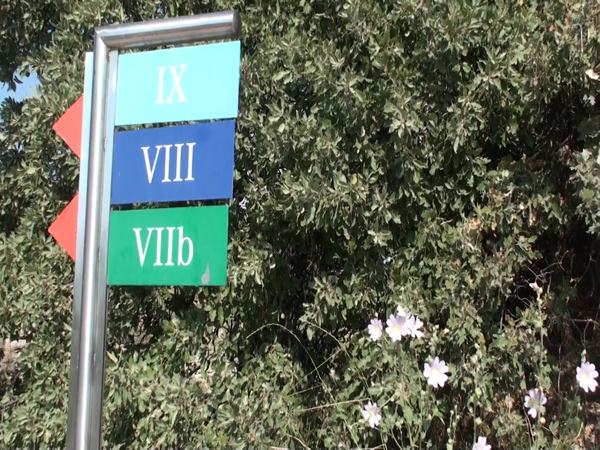
Figure 6. A directional sign at Troy indicating the way to archaeological layers IX, VIII, and VIIb that could be improved by the inclusion of a map depicting the relationship of the archaeological layers to the surrounding environment.
Seventy-nine signs (73.1%) contained attribute information and 50 signs (46.3%) contained historical information. The relative lack of historical information across signage was particularly problematic for Troy: as a UNESCO World Heritage Site, knowledge of Troy’s history is critical to the visitor experience. For instance, the sign “Flora and Fauna of Troy” (Figure 7) included pictures of plants and animals at Troy but did not describe their historical context, thus leaving visitors to speculate as to whether these plants and animals were found in Ancient Troy as well as in the modern day.
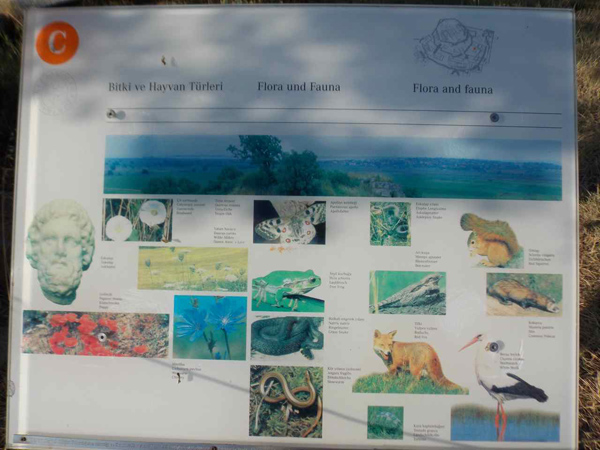
Figure 7. Flora and Fauna of Troy. The small text describes the name of each species in Turkish, German, and English. A description of the historical context of these species (rather than just these generic photographs) would improve this sign.
KNOWLEDGE OR INSTRUCTION PROVIDED
Declarative knowledge was the most common form (63.9%) of embedded knowledge found in the sample (Table 2). Identification signage often contained declarative knowledge in the form of POI identifications (see Figure 8, identifying the location of Layer III). While such identification is essential for confidently locating features at Troy—and thus getting a full sense of the complexity of the Troy site—declarative knowledge is not limited to superficial identifications. Declarative knowledge broadly imbues objects with meanings and significance. Troy could use declarative knowledge in a deeper way by including interpretative information about cultural or physical significance to enrich the visitor experience.
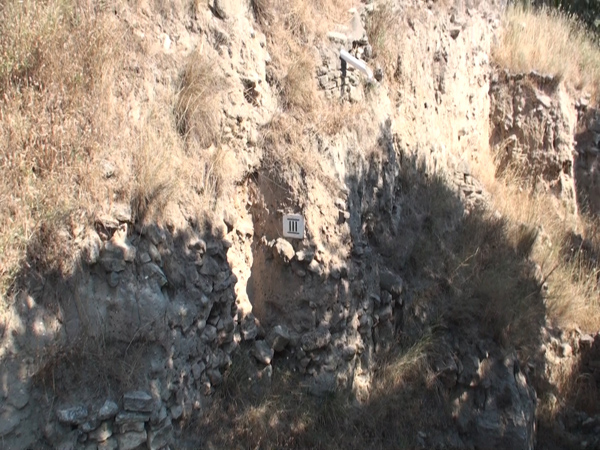
Figure 8. An identification sign showing the location of layer III provides no other declarative knowledge such as its date. Including the date would make the sign more useful.
Procedural instructions were found in 40 instances (37.0%) of the on-site signage. All directional signage (100%) contained procedural knowledge in the form of navigational instructions to a point of interest, such as a given layer of the archaeological site or the location of the bathrooms. Unfortunately, signs directing visitors to specific layers were likely to be confusing, because the signage used the letter and roman numeral labels assigned to the site over the years by archaeologists for research purposes (e.g., VIIb). Thus the procedural knowledge embedded in informational signage often failed cartographically.
Informational signage is encountered in a sequence as visitors walk the tourist path, and each sign has a sequence number in an orange circle (Figure 9). Unfortunately, as seen in Figure 10, the sequence uses a confusing mix of letters and numbers that is only somewhat ordered (1A follows A, C follows 3, etc.). This makes navigating the sequence difficult, and visitors might be led to believe they had made a wayfinding error when in fact they were on the correct path. This issue is likely exacerbated by the short amount of time tourists spend on-site when visiting with a tour bus. A comprehensive redesign of the procedural wayfinding strategy is needed to clearly mark recommend tourist routes in a logical and informative order using color coding or a logical sequence of numbers.
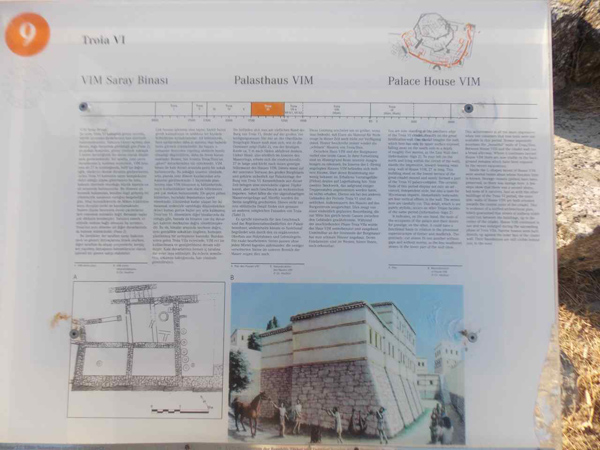
Figure 9. Procedural information on an informational sign (orange circle in upper-left-hand corner) found on the tourist route.
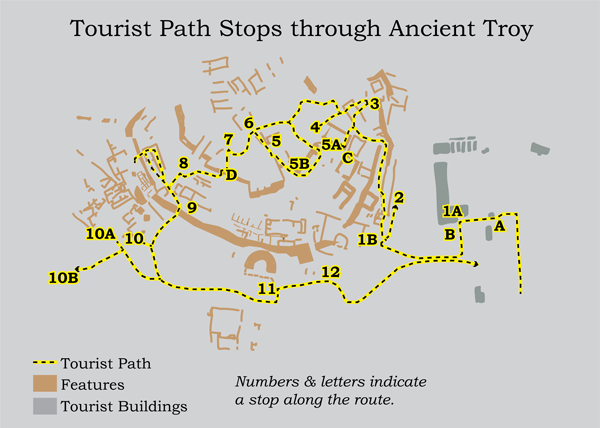
Figure 10. The order of informational signage along the tourist path at Troy. The numbers attempt to provide procedural information; however, this information does not follow a logical linear sequence. In a walk-through of the Troy loop from the visitor center, a visitor would experience the following sequence of procedural directions on informational signage: A, 1a, B, 1b, 2, 1b, 3, C, 3, 4, 5a, 5b, 5, 6, 7, D, 8, 9, 10, 10a, 10B, 11, 12. Map based upon Korfmann & Mannsperger (2013).
Finally, configural knowledge, or knowledge of spatial relationships, was embedded in the form of small inset maps with the layer(s) of interest colored on a gray basemap (Figure 11). Configural knowledge was found exclusively on informational signage, or signage that provides information about a phenomenon (20.4% of signs at Troy; Table 2). Unfortunately, these representations were limited because they lacked an indication of directionality to help visitors understand the configural information in the context of the current vista.
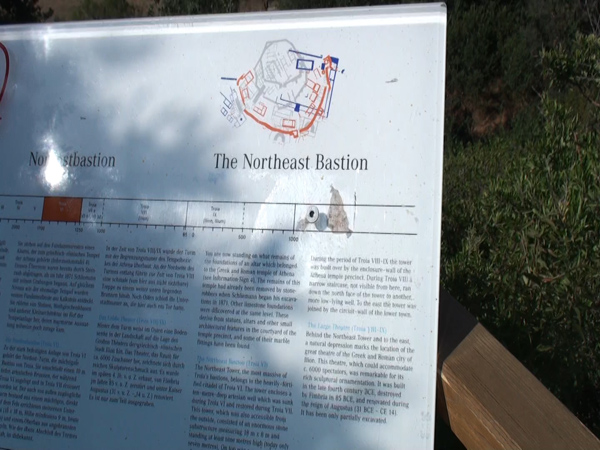
Figure 11. An example of configural information present on informational signage. The map, intended to function as a locator map, does not include a You-Are-Here symbol or match the perspective the visitor faces. Changing to a heads-up display and including a You-Are-Here symbol will make this map more effective.
INTERPRETANT-AS-MEDIATOR
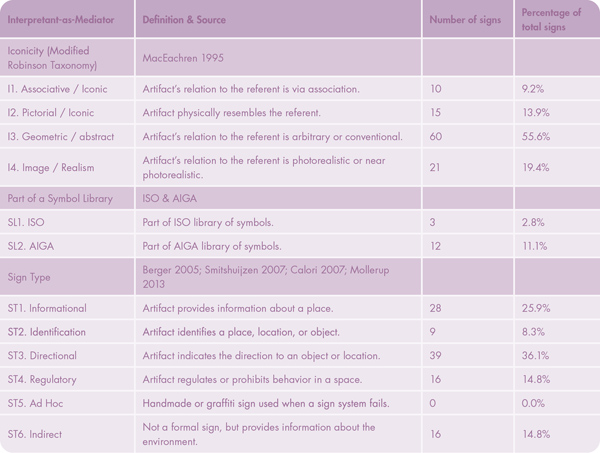
Table 3. Interpretant as Mediator results.
ICONICITY
The least common representation strategy at Troy was to utilize an associative / iconic solution (9.2%; Table 3). Meanwhile, pictorial / iconic solutions were found in only 15 signs (13.9%). Pictorial or associative representations are helpful at Troy because these representations present information in a readily understandable format, although with the drawback of potentially relying on culturally specific meanings. An example of a pictorial solution would be to depict the site’s Trojan Horse replica as a simplified icon. However, a drawback is the difficulty in creating an effective pictorial or associative solution for display at map scale, given the complexity of the archaeological features at Troy. One way to solve this problem is to go beyond pictorial / iconic solutions to the level of image or realism. Unfortunately, this approach was not taken in an effective matter, as discussed later in this section, and this remains a missed opportunity at Troy.
Geometric / abstract designs (55.6%) were the most common symbol solution at Troy (Table 3). These designs can be useful as conventional symbols, but they require prior knowledge on the part of the visitor or a consistent legend in order to be understood; otherwise, immediate communication of complex meaning is difficult or impossible. For instance, Figure 12 shows an abstract representation of the layers of the archaeological site (see the left-hand arrow), but without a background in archaeology a visitor will not be able to understand how the shapes correspond with the actual features they are looking at in the landscape. Geometric / abstract map symbols and signage are particularly important at Troy because the landscape provides few landmarks that are recognizable without the presence of a sign to help the visitor connect maps and signage to the surrounding environment.
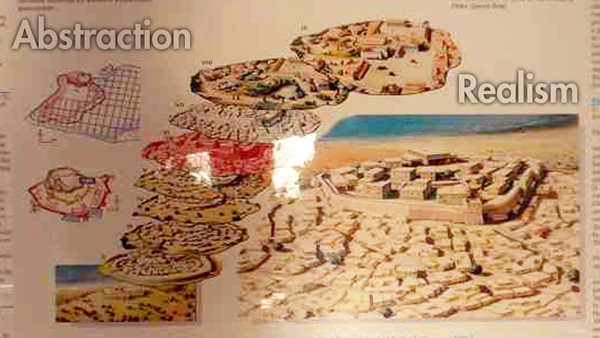
Figure 12. Extremes of abstraction (left) and realism (right) found on an informational sign at Troy. The abstract designs are difficult for a visitor to understand without a background in archaeology, especially given the lack of a legend. The realistic designs are so detailed that visitors may be overwhelmed by excess detail and lose connection between the map and the environment. The mismatched representation would be improved with consistency in iconicity. Note also the reflection on the signage that impedes legibility, which will be discussed later.
Image / realism was the second most common iconicity strategy at Troy: 21 signs (19.4%) utilized this approach (Table 3). Realism was presented in the form of artistic interpretations of the city during different time periods (Figure 12). Because Troy is a ruin, the “true to ancient life” visual interpretations of ancient Troy are difficult to match with the modern environment (Figure 13). Including realistic images of the environment as it appears to the contemporary viewer, emphasizing salient landmarks, will help the viewer associate the information on the sign with the present vista.
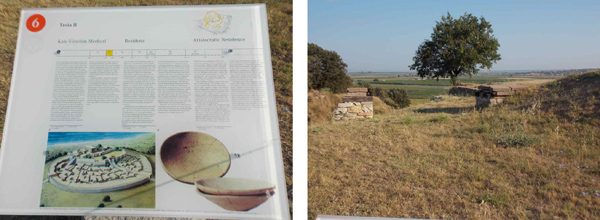
Figure 13. Left: Signage with a realistic map (bottom left) and an abstracted map (top right). Right: Vista. It is difficult to relate the map to the environment because it doesn’t show salient landmarks.
Notably, 29 artifacts could not be coded for iconicity: 12 signs contained only text and 16 signs were indirect, using neither text nor pictures. The all-text signs were prohibition signs or identification signs (Figure 14). As signage at Troy is written in some combination of Turkish, German, and English, additional visual content would help the signs communicate with visitors who are unable to read these languages.
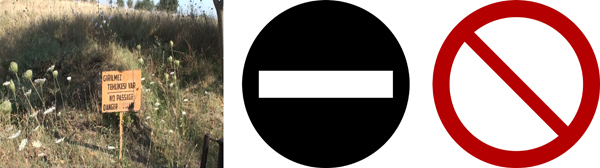
Figure 14. A prohibition sign (left) that could be improved with the use of symbols, such as a modified AIGA symbol for “no entry” (center) or the ISO symbol for “no access” (right). Typically, a second symbol is placed behind the ISO prohibition symbol to specify the type of prohibited access.
SIGN LIBRARIES
Of the 108 signs in the analysis, 15 (14.1%) used standard symbols for Parking, Bathroom, and No Smoking (Table 3). Of these signs, 4.6% took symbols from the ISO library, and 9.5% were symbols from the AIGA sign library (Figure 15). An opportunity was missed to leverage the ISO and AIGA symbol libraries more consistently to standardize the visitor experience at Troy. The use of so few standard symbols led to a reliance on text across Troy’s signage, and inclusion of custom abstract or realistic symbols when text was supplemented with visuals.
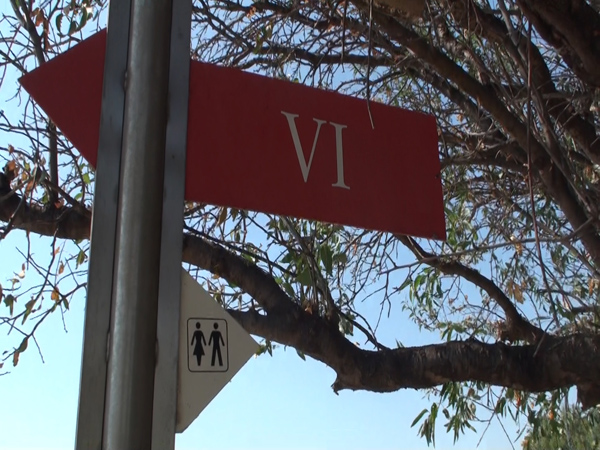
Figure 15. Associative ISO symbol for “bathroom” as used in a sign at Troy.
SIGN TYPE
While Table 3 gives the quantities of each sign type (e.g., regulation, directional), the results of this content analysis cannot suggest whether increasing the number of signs of one type or another is appropriate. Many of these signs are necessitated by the particular shape of the tourist path, and so suggestions on changing them would first require an analysis and possible redesign of the path. That would be a viable future direction for this project, but for now, I can only comment on the design of the signs, not their quantity.
SIGN-VEHICLE-AS-MEDIATOR
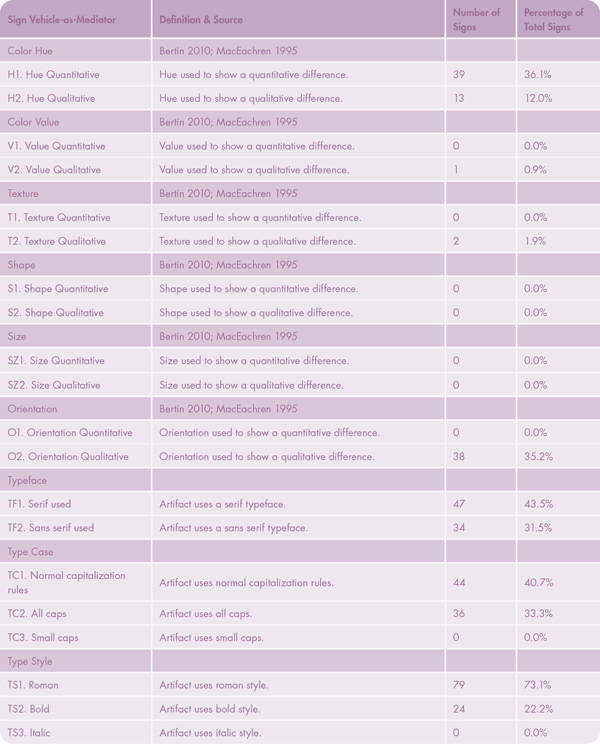
Table 4. Sign-Vehicle-as-Mediator results.
SYMBOLIZATION
Color hue was the most frequently used visual variable to represent quantitative differences (36.1%; Table 4), despite recommendations from semiotics to reserve color hue for depicting qualitative differences. On maps and signage, color hue was used primarily to show a temporal difference between the historical layers at Troy (following color conventions established by Dörpfeld [1902]), or to highlight positions along a timeline (Figure 16). The symbolization of historical information would be clearer if the spectral color scheme relying solely on color hue was replaced with a sequential scheme modifying color value in addition to color hue.
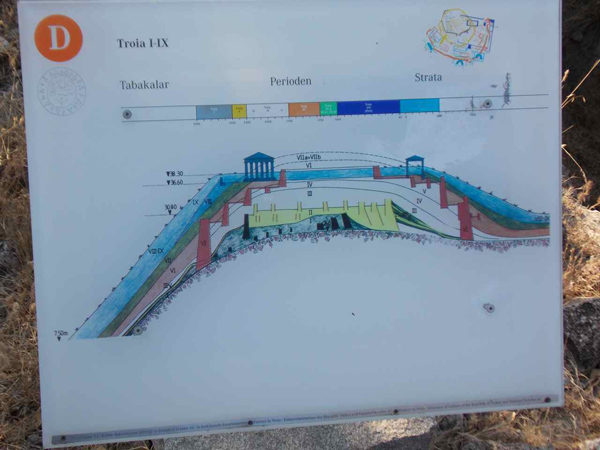
Figure 16. An informational sign showing the strata throughout Troy. Color hue is used to show quantitative data in the timeline, when a sequential scheme relying on color value would have been an improvement. Cross-section maps such as this one would have been useful in other locations throughout the archaeological site to help the visitor understand the complicated strata.
No artifacts at Troy used the visual variable of size to communicate quantitative differences, though it is the strongest variable for this purpose. This is due to the site’s focus on reference mapping rather than thematic mapping to support the user experience at Troy. There is an opportunity to add statistical archaeological information to the maps and signage in addition to the map-based wayfinding information, such as quantities of artifacts found.
While only color hue was used in quantitative representations, color hue, color value, texture, and orientation were used qualitatively (Table 4). Color hue (12%) was used to highlight features of interest on maps and signage or to indicate categorical differences in Troy’s features, though individual hues were unfortunately not used consistently across identification signage (Figure 17). Also, several signs used hues that contrasted poorly with their surroundings (Figure 17, center image) and engraved or embossed signs had text which contrasted poorly with the sign's background (Figure 17, left image). The poor contrast decreased the legibility of the signage and indicated that color value variation within a color hue, or outer framing may be needed to increase contrast within a sign or account for variable environmental conditions.
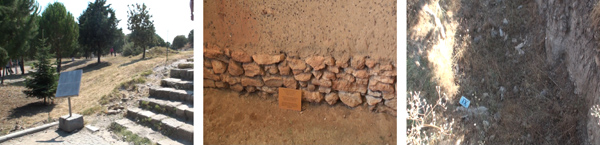
Figure 17. Various styles of identification signage at Troy. The inconsistent choice of color hue requires visitors to read these signs in order to know their function rather than inferring it from the qualitative use of color hue alone. Using color hue consistently will enhance the function of these signs.
The qualitative use of orientation was found in all directional signage (100%). Here, a triangular symbol found on either side of a signpost pointed out the direction to the indicated phenomenon. This effective qualitative use of orientation could also be applied in identification and informational signage to indicate the direction a visitor should look when arriving at a point of interest. However, this orientation cue in some on-site signage contained no obvious meaning, as the triangles pointed at nothing in particular, causing confusion (Figure 18). This “signage to nowhere” should be removed from the site.
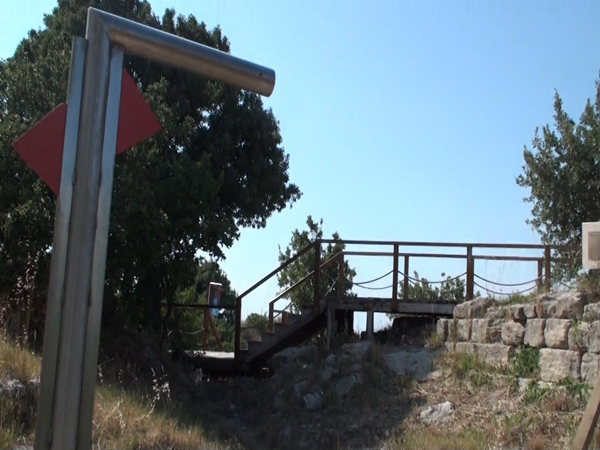
Figure 18. Signage using the visual variable of orientation without any clear meaning caused confusion at Troy. This sign should be removed.
The qualitative use of shape—a strong visual variable for depicting categorical data—did not appear in any signage (0%). Shape could have been used to indicate features of interest or to coordinate points of interest across maps and signage. For example, the shape of the signage itself could have provided information about the contents of the signs, enabling the visitor to distinguish between informational signage and regulatory signage at a glance.
TYPOGRAPHY
The typography sub-category included codes for type class, case, and style (Table 4). While all materials from the visitor center contained type, 16 on-site signs (14.8%) did not contain text because they functioned as indirect signage, as no text was needed to communicate the information that these signs conveyed (Figure 19).
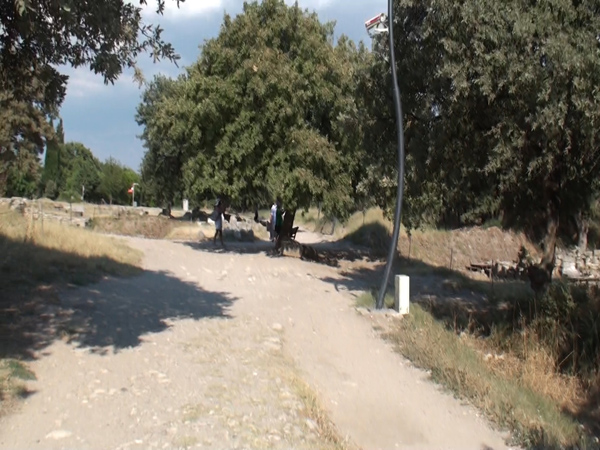
Figure 19. Surveillance placed in a prominent location: an indirect sign indicating the visitor is being watched. No text is needed to explain the function of this sign.
Nearly half (43.5%) of on-site signage featured a serif typeface (Table 4). However, the typeface was not consistent across the signage, which would have been preferable. It is cartographically conventional to label natural phenomena in a serif typeface, and doing so on signage would increase congruency between referent and sign-vehicle. Like serif typefaces, the sans serif typefaces used for on-site signage were not consistent across Troy. Additionally, sans serif typefaces found in signage were sometimes hand-made (Figure 20), giving the signage a slapdash, unprofessional appearance.
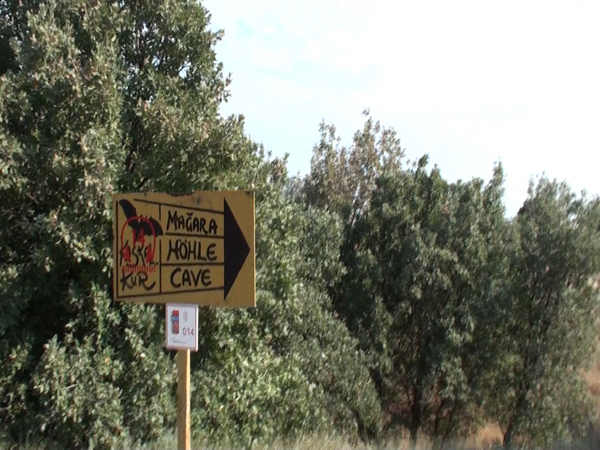
Figure 20. Directional sign with obviously handmade sans serif typography. This sign should be redesigned with a more professional looking sans serif typeface.
Roman type (73.1%) was the overwhelming choice for signage at Troy (Table 4). No signage included italics, but roman type was paired sparsely with bold type, which occurred on 24 signs (22.2%). The complementary use of bold and italics with the roman type can emphasize important or special details in signage and encode additional nominal and ordinal information in maps, thereby improving their effectiveness.
EXPERIENTIAL GRAPHIC DESIGN
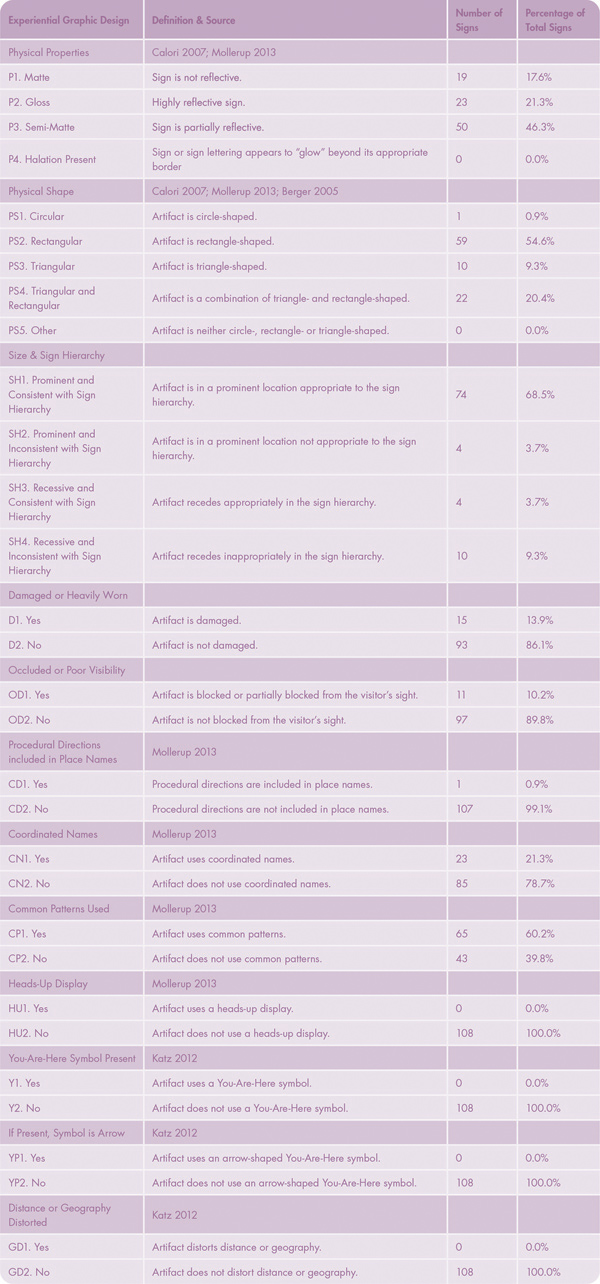
Table 5. Experiential Graphic Design considerations.
PHYSICAL PROPERTIES
The physical characteristics of the signage at Troy impacted its effectiveness. Nearly half of the 108 signs were semi-matte (46.3%; Table 5), followed by matte (17.6%) and glossy (21.3%). Matte and semi-matte signage did not present legibility problems, but glossy signage was difficult to read in conditions of bright light and dark shadow (Figure 21). This should be replaced with the use of matte or semi-matte signage.
Figure 21. Lighting conditions impede the legibility of glossy signage due to reflections caused by bright sunlight (left) and shadows (middle). Compare with the matte signage in bright sunlight (right). The design of the two signs on the left can be improved with using a matte or semi-matte material.
SIGN SHAPE
The majority of signage at Troy was rectangle-shaped (54.6%; Table 5). Only one regulation sign was circle-shaped (0.9%), conforming to ISO sign shape standards. Although a small number of signs were triangle-shaped (9.3%), this triangular shape was not used to carry the conventional semiotic meaning of caution or warning. Some signage combined a rectangular sign with a single triangular edge (20.4%). This signage functioned well when providing general directions to a destination such as a parking lot or a bathroom but was ineffective when indicating a layer of the complex archaeological site, given the ambiguity in relating the direction to a subterranean feature in the landscape without additional interpretive cues (Figure 22). Pairing this directional signage with maps that illustrate stratigraphy would help solve this problem. Solutions such as adding a You-Are-Here symbol and rotating the top of the map to the visitor’s current perspective would further tie these ambiguously shaped directional symbols into the overall map and signage strategy.
Figure 22. Ambiguous directional signage attempts to communicate the location of Troy I. Where in the environment is Troy I? An opportunity was missed to pair directional signage with maps that explain what the visitor should recognize in the environment.
SIGN HIERARCHY
The majority of signage at Troy was prominent and exhibited a consistent sign hierarchy, with more important signs being more prominent (68.5%; Table 5). However, four very large “No Smoking” signs were inappropriately prominent, thereby causing distraction (Figure 23). While smoking poses a fire risk to the site and smoking prohibitions are uncommon in Turkey, visitors to Troy need to gain more from their experience than the knowledge that smoking is prohibited. Raising the prominence of other information in the sign hierarchy may help solve this problem.
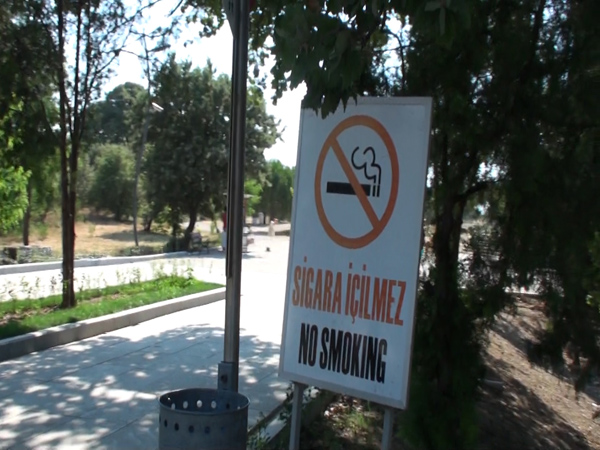
Figure 23. This prominent “No Smoking” sign is inconsistent with the sign hierarchy. The size of this sign can be reduced.
Similarly, ten signs were recessive in a way that was inconsistent with the sign hierarchy (9.3%). They were placed in shaded locations used as waypoints during the hot Troy summers and were difficult to see from the trail. Some of the recessive signage included identification signs (Figure 24) that could cause visitors to become frustrated when they could not confirm that an important vista or point of interest had been reached. Of more concern, visitors failing to see recessive regulation signage could enter a dangerous area off the tourist path, leading to injury or damage to the site (Figure 25).
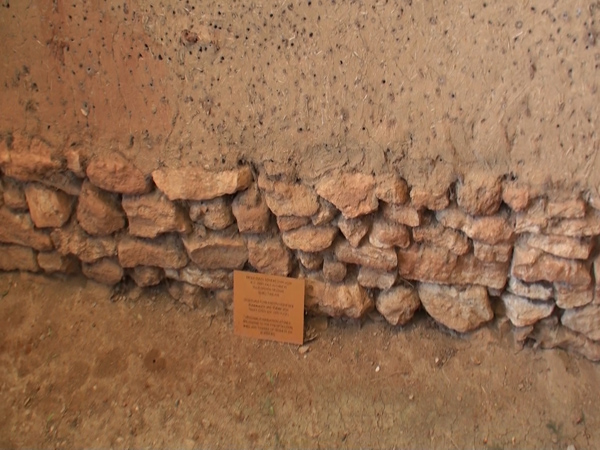
Figure 24. Recessive identification sign, inconsistent with the visual hierarchy. This sign is not readable without a zoom lens. Changing the size or placement of this sign will improve its ability to serve its intended function.
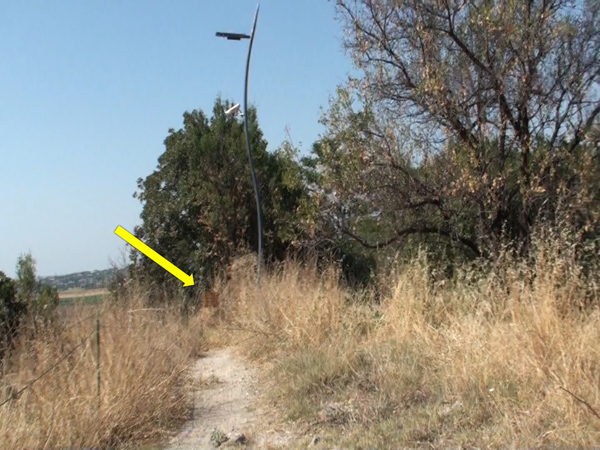
Figure 25. Recessive regulation sign, inconsistent with the visual hierarchy. This sign advises that the tourist path ends, but a visitor must walk up to the sign (and thereby leave the tourist path!) to learn this information. The sign will be more functional if moved to a visible location.
DAMAGE AND OCCLUSION
Some signage at Troy was ineffective due to material damage (13.9%; Table 5; Figure 26) or occlusion (10.2%) by environmental elements such as foliage (Figure 27). Ineffective signage impairs the visitor experience and contributes to a potentially unsafe situation. The occluded signage demonstrates the importance of maintaining the Troy site in a manner that preserves the signage hierarchy. Also, signage should not be placed in areas where it cannot be regularly maintained, even if the positions are visually salient.
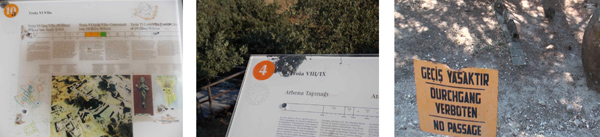
Figure 26. Damaged signage is difficult to read and hurts the visitor’s experience of Troy. These signs should be repaired or removed.
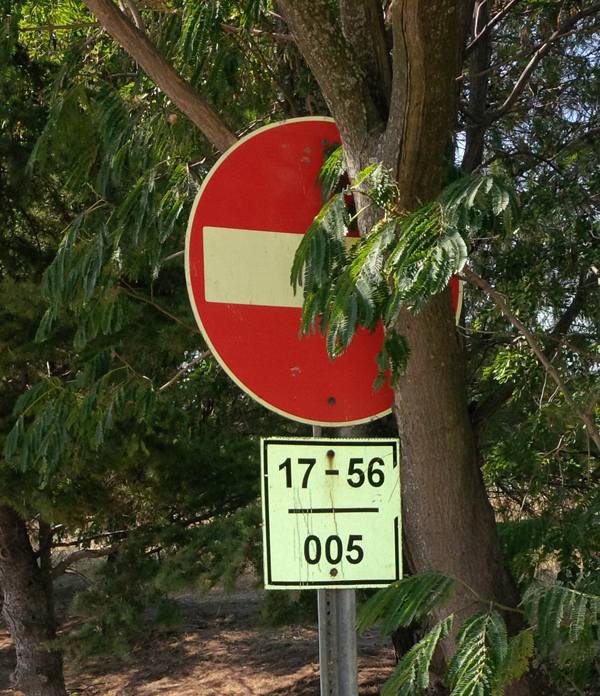
Figure 27. Occluded sign. Trimming foliage will improve the visibility of this sign.
WAYFINDING INFORMATION
The signage at Troy could have been greatly improved by the inclusion of wayfinding information using best practices from experiential graphic design. Missed opportunities include utilizing a heads-up display to orient visitors to the features in front of them (0%; Table 5), and You-Are-Here symbols (0%). By making better use of wayfinding information, the signage at Troy could have better served the needs of visitors.
DISCUSSION: DESIGN IMPERATIVES
Sing in me, O Muse, and through me tell the story.
Opening of Homer’s Odyssey, and a summary of best practices for historic signage design.
In this study, I have explored the ways that signage at Troy could be improved using the principles of cartographic semiotics and best practices of XGD through conducting a quantitative content analysis of the signage found on site at Troy. The results of the content analysis were used to derive a summary table of recommendations for signage at Troy, addressing specific deficiencies in the Troy visitor experience with improved design of maps and signage (Table 6). My analysis revealed new avenues for signage development beyond existing recommendations in the literature. For example, when analyzing the topic of embedded knowledge, it became apparent that on-site signage underutilized maps and configural information. Addressing that broad-level deficiency requires a holistic approach of considering (1) design opportunities for utilizing maps and configural information, and (2) other best practices that Troy’s signage does not follow, such as the inclusion of more geographic information and geometric / abstract representations. This specific approach would not have been apparent before conducting the analysis. In other words, the literature provided a framework, but the empirical work identified the design gaps at Troy. The design imperatives in Table 6 aim to take the gaps in the focused study and speak back to the literature. Although the recommendations are specific to Troy, they can also be generalized for use at other archaeological sites.
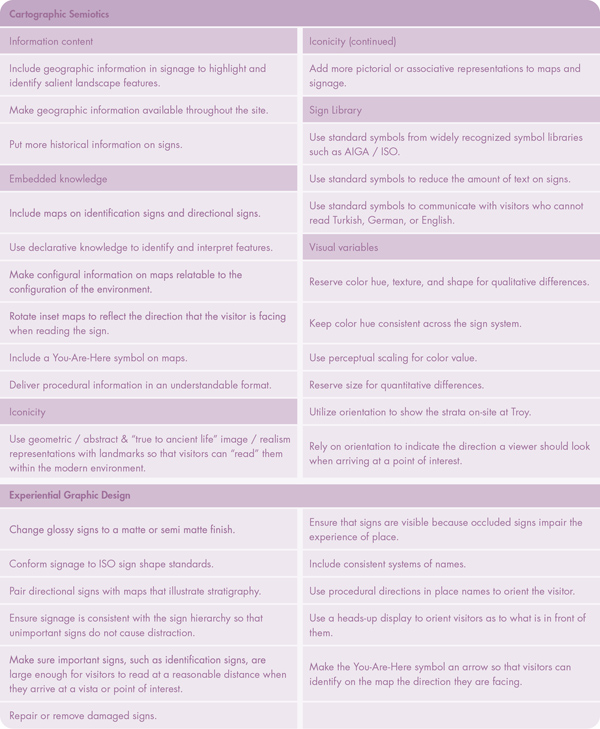
Table 6. Design imperatives derived from the content analysis.
LIMITATIONS
Limitations to this study include the time period of the analysis, which was a time of transition for Troy. The photos of the artifacts were collected in the summer of 2014. Since then, the maps and signage may have changed at the site. Thus, any revisions to maps and signage at Troy based on the above recommendations need to account for changes to the site, including the opening of a nearby Troy museum in 2019. Relating to the content analysis itself, I did not have a second coder to enhance coding replicability.
There were several aspects of the visitor experience at Troy that I did not capture due to the limited time I had on site. Additional dimensions that I would have liked to have captured included the correspondence of audio guides to vistas, the physical dimensions of the maps and signage, and important landmarks or vistas that were off the tourist path or otherwise not identified with a sign. Regarding the latter, I am unable to identify locations at Troy where additional maps and signage are needed—an important consideration for wayfinding and the visitor experience—as the study focused solely on the content of existing signs.
This study focused on the ways in which information was displayed to visitors at Troy but did not focus on the historical content itself, such as the choice of the specific historical information appearing on a given sign. Conducting an interview study to understand the needs of stakeholders such as locals, visitors, and researchers would expose aspects of the historical content missing in the maps and signage as well as capture broader opinions, values, and reactions to maps and signage at Troy. However, the collection of primary information from these stakeholders was outside of the project’s scope due to the limited time on-site.
CONCLUSIONS: FROM SIGNED TO DESIGNED
There are several future potential directions for this research. This study could be repeated across multiple historical sites, using the same QCA coding scheme, to produce a cartographic semiotics / XGD checklist for maps and signage that ensures that the signage in the environment is communicating effectively with the visitor. Another valuable direction is to complement this study with an examination of the effects of digital tools, such as audio tours, interactive displays in the museum, and augmented reality via mobile devices. This will enrich our knowledge about designing not only signage, but an entire visitor experience. Lastly, further exploration of the intersection of cartography and XGD would be beneficial for both fields. Each can share their respective insights into the design process, the consistency of representations, and the structure of the visual hierarchy. These insights will result in better maps produced by experiential graphic designers, while giving cartographers a better awareness of the wider environment in which their maps are used.
Improving the user experience by ensuring that Troy has a functional sign system will attract more visitors, which will increase its public visibility and likelihood of attracting funding, thereby furthering its preservation. The outcome of this study is a series of recommendations, grounded in cartographic semiotics and XGD, that will hopefully help future designers transform this legendary UNESCO World Heritage Site from a signed experience into a designed experience, so that Troy may inspire visitors for generations to come.
ACKNOWLEDGEMENTS
I would like to thank Dr. Robert Roth and this article’s anonymous reviewers for their invaluable feedback on this article.
This research was supported by funding through the Trewartha Research Grant provided by the University of Wisconsin–Madison Department of Geography. Generous funding was also provided by the University of Wisconsin–Madison Molecular Archaeology Group.
REFERENCES
AIGA. n.d. “Symbol Signs.” Accessed April 30, 2016. http://www.aiga.org/symbol-signs.
Arthur, Paul, and Romedi Passini. 1992. Wayfinding: People, Signs, and Architecture. New York: McGraw-Hill Ryerson.
Berger, Craig. 2005. Wayfinding: Designing and Implementing Graphic Navigation Systems. Switzerland: Rotovision.
Bertin, Jacques. 2010. Semiology of Graphics, translated by William Berg. Redlands, CA: Esri Press.
Calori, Chris. 2007. Signage and Wayfinding Design: A Complete Guide to Creating Environmental Graphic Design Systems. Hoboken, NJ: John Wiley and Sons.
Culler, Jonathan. 1981. “Semiotics of Tourism.” The American Journal of Semiotics 1 (1): 127–140. http://doi.org/10.5840/ajs198111/25.
Dörpfeld, Wilhelm. 1902. Troja und Ilion. Ergebnisse der ausgrabungen in den vorhistorischen und historischen schichten von Ilion 1870–1894. Athens: Beck & Barth.
Federal Highway Administration. 2012. Manual on Uniform Traffic Control Devices. https://mutcd.fhwa.dot.gov/pdfs/2009r1r2/mutcd2009r1r2edition.pdf.
Gibson, David. 2009. The Wayfinding Handbook: Information Design for Public Places. Princeton, NJ: Princeton Architectural Press.
Golledge, Reginald, and Robert Stimson. 1987. Analytical Behavioral Geography. London: Croom Helm.
Hoopes, James. 1991. Peirce on Signs: Writings on Semiotic by Charles Sanders Peirce. Chapel Hill, NC: University of North Carolina Press.
International Standards Organization (ISO). 2007. “Graphical symbols – Public information symbols.” https://www.iso.org/obp/ui/#iso:std:iso:7001:ed-3:v1:en.
Katz, Joel. 2012. Designing Information: Human Factors and Common Sense in Information Design. Hoboken, NJ: John Wiley and Sons.
Kessler, Fritz, and Terry Slocum. 2011. “Analysis of Thematic Maps Published in Two Geographical Journals in the Twentieth Century.” Annals of the Association of American Geographers 101 (2): 292–317. http://doi.org/10.1080/00045608.2010.544947.
Korfmann, Manfred O., and Dietrich P. Mannsperger. 2013. Troia / Wilusa Guidebook, translated by Jean D. Carpenter Efe. İstanbul: Biltur Basım Yayın ve Hizmet A.Ş.
MacEachren, Alan M. 1995. How Maps Work: Representation, Visualization, and Design. New York: Guilford.
MacEachren, Alan M., and John H. Ganter. 1990. “A Pattern Identification Approach to Cartographic Visualization.” Cartographica 27 (2): 64–81. http://doi.org/10.3138/M226-1337-2387-3007.
Mollerup, Per. 2013. Wayshowing > Wayfinding. Basic and Interactive. Amsterdam: BIS Publishers.
Monmonier, Mark. 1989. Maps with the News. Chicago: University of Chicago Press.
Morris, Charles W. 1938. Foundations of the Theory of Signs. Chicago: University of Chicago Press.
Muehlenhaus, Ian. 2011a. “Another Goode Method: How to use Quantitative Content Analysis to Study Variation in Thematic Map Design.” Cartographic Perspectives 69: 7–30. http://doi.org/10.14714/CP69.28.
———. 2011b. “Genealogy that Counts: using Content Analysis to Explore the Evolution of Persuasive Cartography.” Cartographica 46 (1): 28–40. http://doi.org/10.3138/carto.46.1.28.
Nöth, Winfried. 1990. Handbook of Semiotics. Bloomington, IN: Indiana University Press.
Ogden, Charles K., and Ivor A. Richards. 1923. The Meaning of Meaning. New York: Harcourt.
Peuquet, Donna J. 1994. “It’s About Time: A Conceptual Framework for the Representation of Temporal Dynamics in Geographic Information Systems.” Annals of the Association of American Geographers 84 (3): 441–461. http://doi.org/10.1111/j.1467-8306.1994.tb01869.x.
Riorden, Elizabeth. 2009. Troy: An Archaeological Site Management Masterplan. Unpublished.
Robinson, Arthur A., Joel L. Morrison, Phillip C. Muehrcke, A. Jon Kimerling, and Stephen C. Guptill. 1995. Elements of Cartography, Fifth Edition. New York: Wiley and Sons.
Roth, Robert E., Richard G. Donohue, Carl M. Sack, Timothy R. Wallace, and Tanya Buckingham. 2014. “A Process for Keeping Pace with Evolving Web Mapping Technologies.” Cartographic Perspectives 78: 25–52. http://doi.org/10.14714/CP78.1273.
Skinner, Jonathan, and Dimitrios Theodossopoulos. 2011. Great Expectations: Imagination and Anticipation in Tourism. New York: Berghahn Books.
Smitshuijzen, Edo. 2007. Signage Design Manual. Baden, Germany: Lars Mueller Publishers.
TripAdvisor. n.d. “Troy (Truva) – Canakkale – Reviews of Troy.” Accessed May 14, 2014. http://www.tripadvisor.com/Attraction_Review-g297979-d324415-Reviews-Troy_Truva-Canakkale_Canakkale_Province_Turkish_Aegean_Coast.html.
UNECE. 2006. “Convention on Road Signs and Signals.” European Inland Transport Committee. https://www.unece.org/fileadmin/DAM/trans/conventn/Conv_road_signs_2006v_EN.pdf.
Urry, John, and Jonas Larson. 2011. The Tourist Gaze 3.0. London: Sage Publications.