DOI: 10.14714/CP93.1555
© by the author(s). This work is licensed under the Creative Commons Attribution-NonCommercial-NoDerivatives 4.0 International License. To view a copy of this license, visit http://creativecommons.org/licenses/by-nc-nd/4.0.
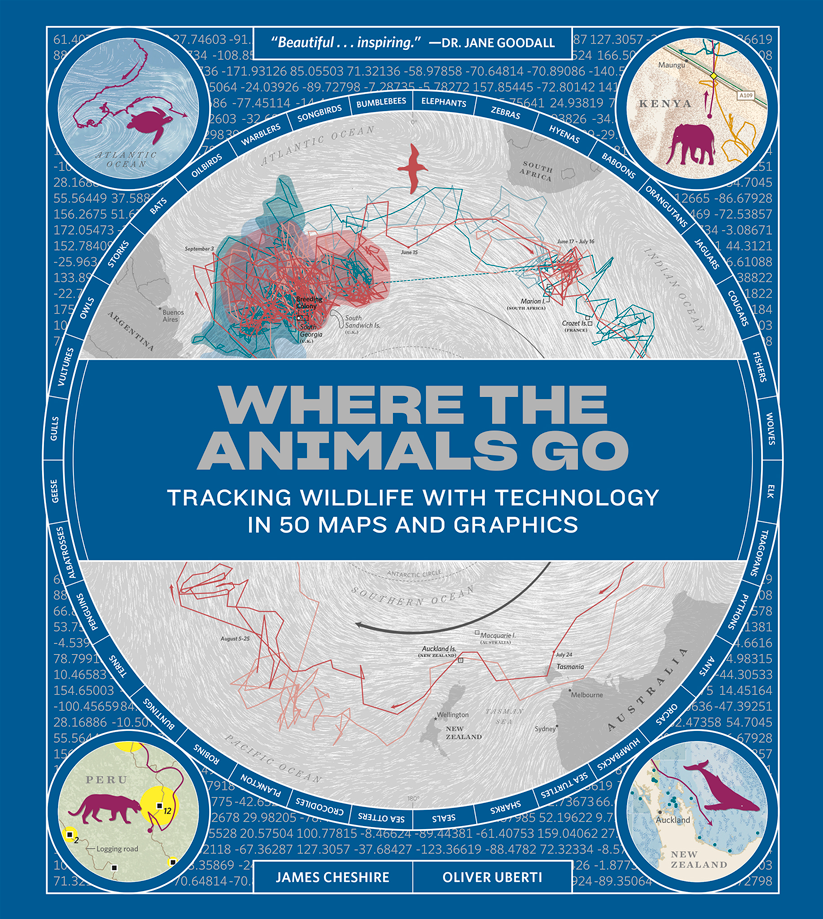
Review of Where the Animals Go: Tracking Wildlife with Technology in 50 Maps and Graphics
By James Cheshire and Oliver Uberti
W. W. Norton & Company, 2017
192 pages
Hardcover: $39.95, ISBN: 978-0-393-63402-0
Review by: Harrison Cole, The Pennsylvania State University
Over the past thirty years or so, GPS receivers, remote-sensing satellites, drones, mobile phone telemetry, and other spatial technologies have had profound impacts on fields ranging from behavioral sciences to military operations to transportation planning. While they have often been developed to better locate people, these technologies have also been applied to tracking and analyzing animal movement and behavior, resulting in the emergence of the interdisciplinary fields of animal biotelemetry and movement ecology. The latter term encompasses a broader range of lifeforms—including plants and microorganisms—and so will be the primary term used for this review. A movement ecology study typically entails tracking organisms, as individuals or as groups, over a period of time that could last anywhere from minutes to years, ultimately yielding a highly detailed geospatial dataset. James Cheshire and Oliver Uberti—a geographer and graphic designer, respectively—have curated a selection of these datasets and mapped them in Where the Animals Go.
The two parts of the book’s subtitle outline its thematic hierarchy: Tracking Wildlife with Technology foregrounds the data science that forms the topical core of the book, while 50 Maps and Graphics points to the supporting role of the illustrations. Where the Animals Go is targeted at a broad audience and is supported with maps that are both expertly designed and backed with expansive data. The authors, their book, and their maps have won a number of awards, including: the London Book Fair Innovation in Travel Publishing Award (2016); the British Cartographic Society Award (Best Overall, 2017); and the North American Cartographic Information Society (NACIS) Corlis Benefideo Award for Imaginative Cartography (2017–2018).
At ten and a quarter by eleven and three-eighths inches, and with only one hundred and ninety-two pages, the book allows for appropriately large spreads without being unwieldy. The maps and visualizations frequently take up double-page spreads, and a handful of the graphics extend to foldout pages. The book comprises thirty-six chapters, each focused on a particular species and each sorted into one of three major sections: terrestrial, aquatic, and aerial creatures. A typical chapter is two to four pages long, with one to three graphics and around 200 to 500 words of description. The first chapters of each section, at around six pages and more than 1000 words, are longer than the following chapters and thus serve as introductions to each section. Each features a collection of graphics and a short narrative about how data science and tracking technology have impacted animal conservation efforts; these themes are carried through the chapters that follow. It may be worth noting that, as implied by the title, the topical content of Where the Animals Go is focused almost entirely on technology, data, and animal conservation efforts, and as a result features little to no discussion about the design of the maps themselves. In other words, it is a book of cartography rather than a book about cartography. This is not out of line with the book’s mission, but cartographers interested in the authors’ creative process should consult other resources such as their keynote speech at the 2018 NACIS Annual Meeting (youtu.be/3hrcziwEyPo), which is re-framed as an article elsewhere in this issue of CP.
The maps are designed in a style that I personally refer to as high data journalism, examples of which can be regularly encountered in periodicals such as the New York Times, Washington Post, and National Geographic—hardly surprising considering co-author Oliver Uberti’s former life as a senior design editor for National Geographic. The style is often characterized by desaturated base maps (often incorporating satellite imagery or shaded relief), uncomplicated symbolization, elegant serifed typefaces, a muted color palette, and ample whitespace. The resulting design gently focuses a reader’s attention on the thematic elements, in this case the tracings of animal movement. Most of the studies featured in Where the Animals Go involve thousands, and sometimes millions, of points that trace out intricate and often serpentine paths across the surface of the planet. While in most of the maps the individual locations are serialized into line features, sometimes the nature of the data—or of the generalization—dictates the use of outlined areas instead.
While the maps in Where the Animals Go are stylistically consistent, they vary substantially in content and scale. For instance, the relatively small extent of bee movement is shown, as one might expect, at a relatively large scale (1:10,000), while the truly remarkable 80,000-mile migration of the Arctic tern requires a map of the entire world. The other forty-eight maps fall between these extremes. Inset maps occasionally augment the larger ones by depicting particular aspects of the study data or other pertinent information. A map of elephant perambulations, for example, is accompanied by a smaller map color-coding each elephant’s range in the dry and rainy seasons. Similarly, a map depicting pheasant tracks also features an elevation graph showing the climbs and glides—of sometimes hundreds of feet— that each pheasant makes along its journey. The longer chapters at the beginning of each section also contain a wider variety of illustrations, including historical maps, a diagram of the mechanics of whale echolocation, and a map of global wind patterns.
As Uberti explains in the Preface, Where the Animals Go was intended to illustrate and celebrate the collaborative research facilitated by advances in technology and data science in general—not just in movement ecology, Together the authors call for continued collaboration amongst scientists, as well as between scientists and other specialists such as “engineers, coders, statisticians, geographers, and designers” (16). Furthermore, the authors implore laypeople—citizen scientists—to become involved as well, citing the Great Backyard Bird Count (gbbc.birdcount.org) as a good example of how technology—in this case, the internet—can facilitate large-scale citizen science research. Of course, given that neither of the authors are themselves movement ecologists, the book itself serves as another example of what can be produced through this new model of interdisciplinary research.
In some ways, flipping through Where the Animals Go is like watching a trailer for a big budget nature documentary; the complexity, scale, diversity, and sheer number of maps in the book do a superb job of expressing the magnitude of the phenomena that they represent. One of the most striking maps in the book depicts the flight paths of albatrosses as they circumnavigate Antarctica (132). While lines trace out the movements of the albatrosses, the map also includes white slashes representing wind patterns and small arrows showing the direction of the birds’ movement. Together, these symbols engender a sensation that you yourself are aloft with the birds as they conduct their journeys. Elsewhere, a pair of maps depicting elk movements during their summer migration around Yellowstone National Park (66–69) differs from many others in the book in that it depicts the general movements of a herd over the course of a typical year, rather than showing specific paths of individual animals. The color scheme and symbolization together result in a highly organic design, as if the location symbols are patches of lichen on a tree branch. In fact, these maps and others appear to be very nearly animated—occasionally reminiscent of Futurist or op art, and a testament to the dynamism that good design can give rise to, even in static documents.
In a strict sense, none of these maps are really visualizing movement itself, but, rather, they string together sampled locations and interpolate connections between each location, thus implying movement. Certainly, the ink on the paper does not itself move, nor do the coordinate points collected in the field. But within that constraint, I wonder if some of these maps could more effectively or creatively represent the phenomenon of movement. For example, the uniform weight and color of the track lines employed throughout the book could be read as implying that the animals travel at a more or less consistent rate of speed. As an alternative, variations in line weights, lightnesses, or even transparencies could be used to represent changes in speed, or perhaps in the number of animals traveling in a group. Many of the tracking devices employed in the studies are able to record speeds as well as locations, but there does not seem to have been any attempt to incorporate this data. It could be argued that in many cases the animal’s speed was irrelevant, or that including it would have overcomplicated the maps, but it is nevertheless reasonable to ask why the map symbols express only the locational component of the field data.
In other cases, though, the authors do a masterful job of conveying the true dynamic feeling of movement. The Yellowstone elk map, for example, depicts herd movements not as here to there or point A to point B phenomena, but rather more like water flows—pouring between, across, and around spaces. The map of goose flight paths over the Himalayas (134–135), though, represents another missed opportunity. Although a key finding of the study concerns the dramatic variations in flight altitude, that data is relegated to a small graph at the bottom of the map. These are more than simple quibbles about technicalities. Cartographers who work with dynamic phenomena have the simultaneous blessing and burden of reckoning with a range of options for visualizing data in order to express or suggest actual movement. These issues have been well studied and discussed in the cartographic literature, notably by Andrienko and Andrienko (2013); Buchin, Speckmann, and Verbeek (2011); and Jenny et al. (2018).
The final chapter discusses how the methods and technologies featured in the book might also be applied to research on human movement and behavior—described as having such practical applications as finding violent criminals, allocating municipal services, or optimizing marketing campaigns. Interestingly, the discussion does not touch on the ways these same methods and technologies are currently being used by governments and corporations in a variety of encroachments upon civil liberties (Crampton 2015; Leszczynski 2015). While the absence of acknowledgment of these concerns does not necessarily detract from the book’s overall narrative, it is a major shortcoming of the closing chapter.
This is not an academic text, so it is light on argument and there is little critical reflection on the implications for how data was gathered or how it was mapped, but, nevertheless, Where the Animals Go does a good job of fulfilling its mission of providing a showcase for interdisciplinary, technology-driven ecological research. The fact that Where the Animals Go is a collection of original thematic maps—in a world where non-academic cartography books typically focus on historical or reference maps—makes this an exciting volume. That the maps are expertly designed and backed with expansive and authoritative datasets just makes it more so. It doesn’t hurt that the book breaks significant new ground in both cartography and movement ecology as a synthesis of studies from several different fields, many of them relatively nascent, or that the writing will appeal to a broad audience of cartographers and non-cartographers alike. Where the Animals Go is a book well worth adding to one’s collection.
REFERENCES
Andrienko, Natalia, and Gennady Andrienko. 2013. “Visual Analytics of Movement: An Overview of Methods, Tools and Procedures.” Information Visualization 12 (1): 3–24. https://doi.org/10.1177/1473871612457601.
Buchin, Kevin, Bettina Speckmann, and Kevin Verbeek. 2011. “Flow Map Layout via Spiral Trees.” IEEE Transactions on Visualization and Computer Graphics 17 (12): 2536–2544. https://doi.org/10.1109/TVCG.2011.202.
Crampton, Jeremy. W. 2015. “Collect it all: National Security, Big Data and Governance.” GeoJournal 80 (4): 519–531. https://doi.org/10.1007/s10708-014-9598-y.
Jenny, Bernhard, Daniel M. Stephen, Ian Muehlenhaus, Brooke E. Marston, Ritesh Sharma, Eugene Zhang, and Helen Jenny. 2018. “Design Principles for Origin-destination Flow Maps.” Cartography and Geographic Information Science 45: 62–75. https://doi.org/10.1080/15230406.2016.1262280.