DOI: 10.14714/CP95.1615
© by the author(s). This work is licensed under the Creative Commons Attribution-NonCommercial-NoDerivatives 4.0 International License. To view a copy of this license, visit http://creativecommons.org/licenses/by-nc-nd/4.0.
Madison and Vicinity: A Tangible Map Quilt
Robert E. Roth, University of Wisconsin–Madison | reroth@wisc.edu
Chelsea Nestel, University of Wisconsin–Madison | nestel@wisc.edu
Tanya Buckingham Andersen, University of Wisconsin–Madison | tanya.buckingham@wisc.edu
Joseph App, University of Wisconsin–Madison | app2@wisc.edu
Monica Cloutier, University of Wisconsin–Madison | mlcloutier@wisc.edu
Chenxiao Guo, University of Wisconsin–Madison | chenxiao.guo@wisc.edu
Alicia Iverson, University of Wisconsin–Madison | iverson3@wisc.edu
Melanie Kohls, University of Wisconsin–Madison | mkohls@wisc.edu
Jackson Lodermeier, University of Wisconsin–Madison | jlodermeier@wisc.edu
Athena McKindsey, University of Wisconsin–Madison | mckindsey@wisc.edu
Ellie Milligan, University of Wisconsin–Madison | mcglynn2@wisc.edu
Pete Nielsen, University of Wisconsin–Madison | pnielsen3@wisc.edu
Catherine Palm, University of Wisconsin–Madison | palm3@wisc.edu
Emily Pettit, University of Wisconsin–Madison | epettit3@wisc.edu
Megan Roessler, University of Wisconsin–Madison | mroessler@wisc.edu
Nick Underwood, University of Wisconsin–Madison | nunderwood3@wisc.edu
Genevieve Vahl, University of Wisconsin–Madison | vahl@wisc.edu
INTRODUCTION
Technology imposes a range of constraints on our design vision. This can be frustrating, especially in the classroom where students are connecting abstract cartographic design concepts to complex digital technology for the first time. However, constraint stimulates creativity, and many innovative maps inspire us because of, not despite, the technological constraints they overcome.
The advanced cartography class at UW–Madison offers a deep dive into narrative & storytelling, aesthetics & design, and ethics & critique in cartography. In the fall semester of 2018, we added a sequence of four sketch mapping activities to this class to enable creative exploration as a warm-up to each technical lab assignment. Sketch mapping is a well-established research method in which participants translate their experiences, emotions, and memories of place into visual representations, with the resulting mental maps taking many possible, equally acceptable forms (Gieseking 2013; Kelly 2016). From a cartographic standpoint, sketch mapping is an important, formative stage in the design process for many practitioners, and arguably a cartographic skill in its own right, with early whiteboarding or wireframing enabling rapid brainstorming, collective discussion of alternatives, and development of storyboards and specification sheets to streamline subsequent design (Lloyd and Dykes 2011; Tyner 2014). As Tierney (2018, 45) writes, “even the roughest sketch is critical to getting into the creative mindset needed to begin a project before getting locked down in the software.”
Beyond research and design, sketch mapping can enable inclusive classroom instruction as well as participatory community engagement, by allowing participants “to be vulnerable without being verbal” (Iverson 2019, 2). For this advanced cartography course, the sketch mapping activities allowed students to tinker and play with lecture concepts in a low-risk environment using familiar, tangible materials such as pens, markers, graph paper, etc. Without the pressure of data wrangling or learning new software, they were able to be more intentional and reflexive during the design process. Students then drew from this creative experience in their four linked lab assignments, which introduced new datasets, technologies, and workflows.
The sketch mapping activities culminated in a tangible map quilt assignment (Figure 1) that took inspiration from two fantastic NACIS collaborative design projects: the 2015 Tangible Map Exhibit (Dooley, Coolidge, and Rose 2016) and the annual NACIS Map Quilt. With a focus on design diversity across the quilt patchwork, this final “sketch” mapping activity used a range of tangible but unfamiliar materials. As Dooley, Coolidge, and Rose write, “By making in a new, unfamiliar medium, we can create judgment-free spaces that allow for experimentation, risk-taking, and the unexpected” (2016, 25). The tangible map quilt activity aligned with several weeks of lectures on aesthetics and style—drawing heavily from the Cartographic Perspectives special issue edited by Buckley and Jenny (2012) and Nestel’s (2019) GIS&T Body of Knowledge entry. It also was paired with an associated multi-week lab assignment introducing Mapbox Studio that required students to deconstruct the style of a prominent artist or designer and replicate the style in a basemap tileset using OpenStreetMap (OSM) data (after Christophe and Hoarau 2012). Thus, the tangible map quilt activity directly reinforced the conceptual and technical learning objectives of the aesthetics and style course module.
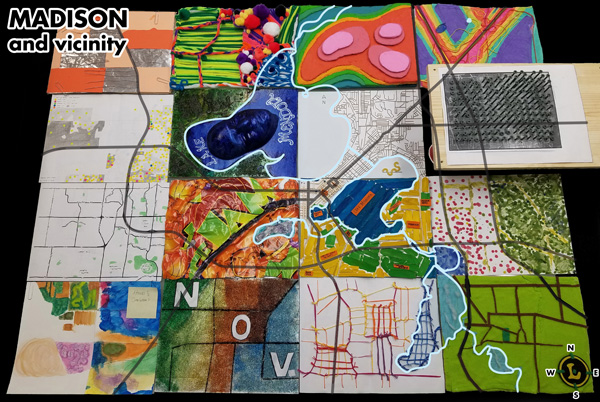
Figure 1. Madison and Vicinity, a tangible map quilt created collectively by an advanced cartography class at the University of Wisconsin–Madison. Shot at an angle of approximately 60° to capture the verticality of the design, with some roads and water features superimposed for context. Data source: OpenStreetMap; Photo: Robert Roth.
ACTIVITY PREPARATIONS AND PROCESS
In the fall of 2018, the class instructors (Rob and Chelsea) prepared the tangible map quilt activity by downloading and projecting unstyled OSM linework for the city of Madison, Wisconsin (USA) and vicinity. We originally downloaded buildings, natural features, points of interest, and transportation infrastructure, but ultimately retained only roads, railways, water, and waterways in the final reference map to reduce complexity. However, we encouraged students to research other features that were not included in the reference basemap. We maintained a minimalist design for the visual hierarchy given the objective of adding tangible styling atop this basemap (Figure 2).
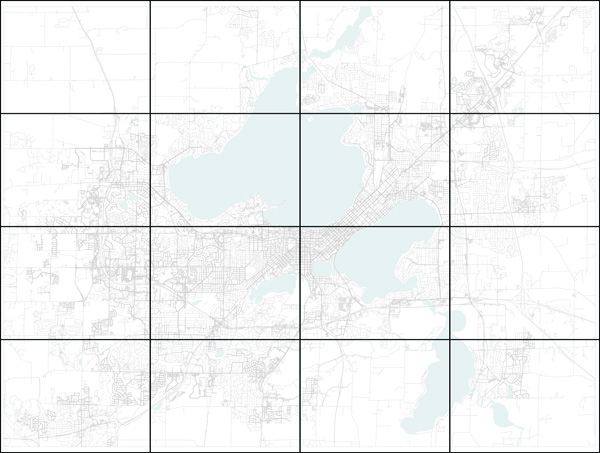
Figure 2. The initial tangible map quilt basemap of Madison with an overlay showing the location of slices for the individual tiles. Data source: OpenStreetMap.
We printed the map quilt basemap on the University of Wisconsin Cart Lab’s large format plotter and sliced the poster into sixteen quilt tiles, each roughly 12×16 inches in size. From this experience, we recommend limiting each tile to a maximum size of A4 or letter to allow students to print their own tile if needed. Reprinting the tile allows a tangible “undo” and supports online instruction.
We then staged the tile and materials selection process around a UW Cart Lab light table (Figure 3). We selected materials to promote diversity in the tile designs across four overarching stylistic dimensions discussed in lecture (see Roth, forthcoming, for discussion), producing a range of tangible but unfamiliar material combinations:
- form: variation in the linework generalization and symbolization (e.g., smooth vs. jagged, curved vs. blocky, thin vs. thick);
- color: the overall palette of primary and accent colours;
- type: any typefaces included as branding and their microaesthetics; and
- texture: additional tactile features (e.g., flat vs. raised, rough vs. smooth, matte vs. shiny).
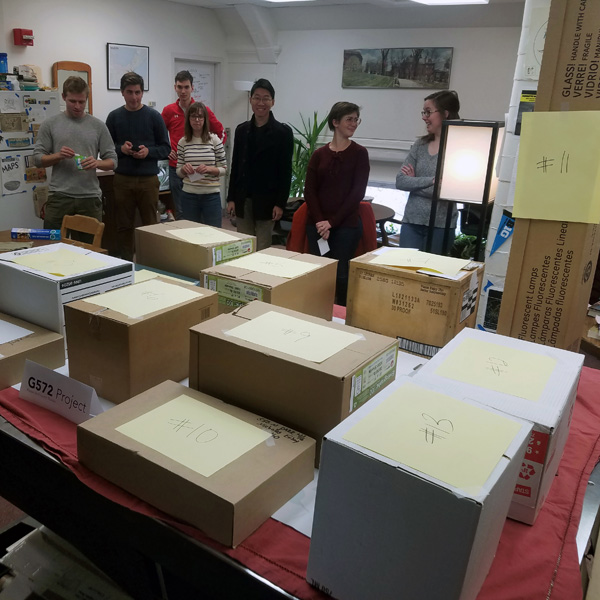
Figure 3. The tile and materials selection process. Photo: Tanya Buckingham Andersen.
Students drew a random number to determine the order they could select their tile location, with areas on campus and along the Madison isthmus selected first. Students then selected their materials in inverse order to compromise preferences between the selected tile and material. We staged the materials like Monty Hall’s Let’s Make a Deal, with one material uncovered and the rest hidden inside separate boxes. Students could select the visible material, or risk selecting a hidden material behind “Door Number Two.” After the selection process, students were given time to make trades, adding cooperation and fun to the activity, but were instructed that they must trade both tile and material together. Ultimately, only one trade was made despite the large amount of humorous brokering.
Since there were sixteen tiles available, and only thirteen students in the class, the students gained revenge upon Rob and Chelsea by assigning each of them one of the remaining tiles and materials. We left the sixteenth tile open as a collective design opportunity for others in the UW Cart Lab.
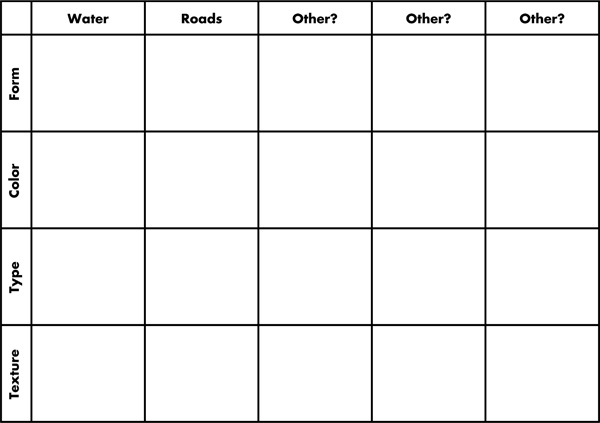
Figure 4. The worksheet used to inform style deconstruction. Image: Robert Roth.
Before starting on their tile, students first evaluated their materials according to the forms, colors, typefaces, and textures they afforded. To facilitate this deconstruction process, and to help students consider how best to apply these stylistic dimensions to the OSM linework and any other prominent features they wished to depict, we provided the worksheet seen in Figure 4. We assigned this worksheet as the first deliverable for the Mapbox Studio lab, where it was described as a spec sheet. Starting from the selection process, students were given the remainder of the lecture period, and the entirety of the following lecture (approximately two hours total) to work on their tangible map quilt tiles (Figure 5).
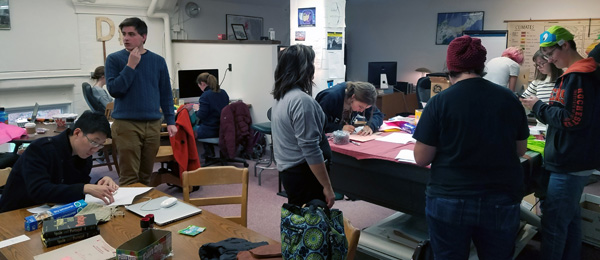
Figure 5. Tangible map quilting in the UW Cart Lab. Photo: Tanya Buckingham Andersen.
DESIGN & REFLECTION
Madison and Vicinity is a tangible map quilt combining aging office supplies from the UW Cart Lab with discount items from a local Dollar Tree store (Figure 6). The colors are diverse and vibrant, ranging from bold popsicle sticks, tissue paper, and friendship string to shimmering glitter, paper clips, and tin foil. Pricing stickers show the socio-demographic composition of West Madison and melted birthday candles dot the green spaces in East Madison. Many tiles are truly three-dimensional, with the terrain of Madison emerging from a crinkled Space Jam™ poster, contoured modeling clay, interwoven fuzzy balls and pipe cleaners, and screws twisted into a wood plank (one full rotation per five feet of elevation, which created a sawdust mess in Rob’s apartment for weeks to come; Figure 7). A styrofoam head enchants as the Lady of Lake Mendota and a macaroni map monster emerges in Lake Monona. In great irony, an ActionScript programming textbook is repurposed as a tangible typographic map of Madison’s west side. And yes, the north arrow is made from the “L” in a Leonardo Teenage Mutant Ninja Turtles™ children’s Halloween costume.
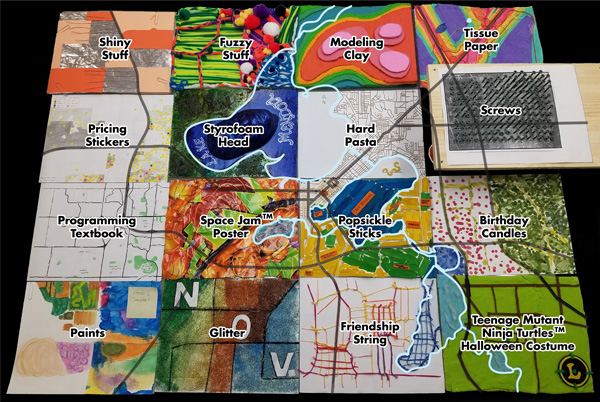
Figure 6. Materials used for the Madison and Vicinity tangible map quilt.
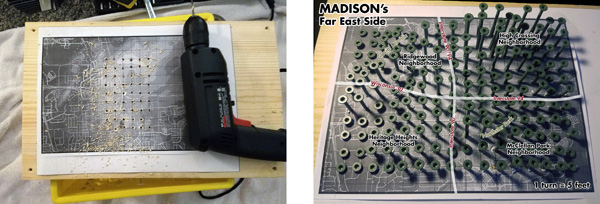
Figure 7. Madison and Vicinity detail view. Photos: Robert Roth.
Reflecting on the activity, we (the instructors, Rob and Chelsea) believe that completing the tangible design process before jumping to digital technology led to less frustration and more experimentation in the subsequent Mapbox Studio lab assignment. Overall, students were more willing to lean into the styling constraints of OSM data and ultimately produced extremely creative designs. We also believe that the tangible map quilt activity led to better comprehension of lecture discussion regarding aesthetics and style on the final exam (a hint to future students finding this article: the final exam now includes an essay question comparing and contrasting your tangible map quilt and Mapbox tile designs). The activity also reinforced the inclusive and supportive community we promote in the UW Cart Lab, as the majority of students from the class continued to work in the Cart Lab the remainder of the academic year without having done so before the activity. Finally, the tangible map quilt activity proved to be a multi-generational success, as the UW Cart Lab’s youngest cartographer and now the youngest published author in Cartographic Perspectives (Athena, age 3) contributed to the collective tile in the bottom-left corner. Thus, we believe the tangible map quilt activity extends well to K–12 education for cartographers of all ages.
Madison and Vicinity currently resides on the third floor of Science Hall on the UW–Madison campus, where it garners a great deal of attention from future cartographers passing by.
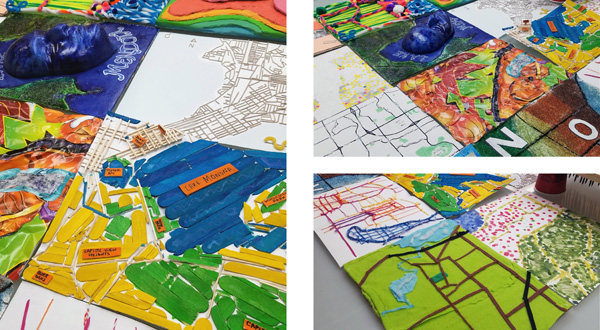
Figure 8. Detail images of Madison and Vicinity. Photos: Robert Roth.
ACKNOWLEDGMENT
This research was funded by NSF CAREER grant #1555267 and the Wisconsin Alumni Research Foundation.
REFERENCES
Buckley, Aileen, and Bernhard Jenny. 2012. “Letter from the Guest Editors.” Cartographic Perspectives 73: 3–12. https://doi.org/10.14714/CP73.786.
Christophe, Sidonie, and Charlotte Hoarau. 2012. “Expressive Map Design based on Pop Art: Revisit of Semiology of Graphics?” Cartographic Perspectives 73: 61–74. https://doi.org/10.14714/CP73.646.
Dooley, Matt, Jake Coolidge, and Caroline Rose. 2016. “The Tangible Map Exhibit.” Cartographic Perspectives 82: 25–36. https://doi.org/10.14714/CP82.1344.
Gieseking, Jack Jen. 2013. “Where We Go From Here: The Mental Sketch Mapping Method and its Analytic Components.” Qualitative Inquiry 19 (9): 712–724. https://doi.org/10.1177/1077800413500926.
Iverson, Alicia Adelle. 2019. “(C)art Therapy: Sketch Mapping Workshops for Early Teens as a Case Study in Post-representational Cartography.” MSc. thesis, University of Wisconsin–Madison.
Kelly, Meghan. 2016. “Collectively Mapping Borders.” Cartographic Perspectives 84: 31–38. https://doi.org/10.14714/CP84.1363.
Lloyd, David, and Jason Dykes. 2011. “Human-centered Approaches in Geovisualization Design: Investigating Multiple Methods through a Long-term Case Study.” IEEE Transactions on Visualization and Computer Graphics 17 (12): 2498–2507. https://doi.org/10.1109/TVCG.2011.209.
Nestel, Chelsea. 2019. “Aesthetics and Design.” In The Geographic Information Science & Technology Body of Knowledge, edited by J. P. Wilson. https://doi.org/10.22224/gistbok/2019.4.14.
Roth, Robert E. Forthcoming. “Cartographic Design as Visual Storytelling: Synthesis and Review of Map-based Narratives, Genres, and Tropes.” The Cartographic Journal. https://doi.org/10.1080/00087041.2019.1633103.
Tierney, Lauren. 2018. “How We Made ‘The Melting of Antarctica’.” Cartographic Perspectives 89: 44–52. https://doi.org/10.14714/CP89.1469.
Tyner, Judith A. 2014. Principles of Map Design: New York: Guilford Publications.