DOI: 10.14714/CP97.1715
© by the author(s). This work is licensed under the Creative Commons Attribution-NonCommercial-NoDerivatives 4.0 International License. To view a copy of this license, visit http://creativecommons.org/licenses/by-nc-nd/4.0.
Review of Cartography: Visualization of Geospatial Data, Fourth Edition
By Menno-Jan Kraak and Ferjan Ormeling
CRC Press, 2021
261 pages, 220 color illustrations
Hardcover: $130.00, ISBN 978-1-138-61395-9
eBook: $117.00, ISBN 978-0-429-46419-5
Review by: Timofey Samsonov, Lomonosov Moscow State University
This volume is the much anticipated update of Menno-Jan Kraak and Ferjan Ormeling’s popular academic textbook—first published in 1996, with subsequent editions in 2003 and 2010. My review will focus mainly on how much the book has changed since its last incarnation, and how well the text reflects recent technological advancements in cartography, as readers are likely most curious about these aspects.
The structure and the overall layout of the book—basically an encyclopedia of mapping in eleven chapters—has remained unchanged. In Chapter 1, “Geographical Information Science and Maps,” the authors draw a broad picture of GIScience and mapping, emphasizing their place in society and their role in scientific cognition. The spatial data sources and data processing technologies used to create maps are discussed in Chapter 2, “Data Acquisition.” The next chapter, “Map Characteristics,” dives into the conceptual matter of cartography—focusing on the unique properties of maps, their functions, and their types, as well as revealing what the authors consider the essence of cartography and the cartographic communication process. Chapter 4, “GIS Applications: Which Map to Use,” discusses the appropriate applications of large- and small-scale mapping, as well as the role of geometric, attribute, and temporal data comparisons in the creation of change maps. Many of the basic processes of mapmaking are addressed in Chapters 5 through 8, which cover “Map Design and Production,” “Topography,” “Statistical Mapping,” and “Mapping Time.”
The book closes with three chapters showing how maps work as exploration and decision-making tools. Of these, Chapter 9, “Maps at Work: Presenting and Using Geospatial Data in Maps and Atlases,” explains various approaches to organizing maps and delivering them into users’ hands, as well as how to use an atlas as an organizational framework for data exploration. “Maps at Work: Analysis and Geovisualization” follows, with a discussion of techniques that can be used to facilitate the visual analysis of electronic maps by combining them with linked data representations such as interactive statistical graphics. Finally, Chapter 11, “Cartography at Work: Maps as Decision Tools,” reflects on numerous aspects of the formal part of map use: legal issues, currentness, accessibility, and so on.
While the overall structure of the book has been preserved from previous editions, the content was substantially revised, with new material that reflects emerging trends and changes in technology. Specifically, several new sections were added:
- The International Cartographic Association’s Cartographic Body of Knowledge (BoK) project receives attention for the first time in Chapter 1. The authors anticipate that the project’s working group and accompanying website will serve as a forum, consolidating many concepts that have come to comprise modern cartography as academic research field.
- The list of data sources discussed in Chapter 2 has been extended by the inclusion of lidar, laser altimetry, Volunteered Geographic Information (VGI), and citizen science. All of these are notable for the increased attention they have received since the 2010s.
- Map machines and story maps now complement the overview given in Chapter 9, and, in that same chapter, map use is now reviewed in the context of atlases, instead of individual maps, in order to stress the increasingly widespread mode of interacting with cartographic representations through interactive atlas-like environments.
Many other updates were incorporated without explicitly altering the book’s structure. Among the multitude of such changes are the following examples:
- The authors discuss the ubiquitous availability of maps delivered through electronic devices, and they touch upon issues of map usability and user-centered design in Chapter 3, “Map Characteristics.”
- A discussion of the possible creation of real-time maps in a smart-city environment based on geosensor data is a new addition to Chapter 4.
- Chapter 5 has been updated to include an explanation of color reproduction on modern liquid crystal display (LCD) monitors that is as fully detailed as was the one found in earlier editions covering the old cathode ray tube (CRT) displays.
- Data formats and technologies used for interactive web map output—such as HTML5, CSS, SVG, WebGL and JavaScript—now figure prominently.
- The outdated Global Map and SABE mapping projects found in the previous version of Chapter 6 have been replaced with a brief discussion of contemporary OpenStreetMap and EuroBoundaryMap initiatives.
- Chapter 7 now devotes a significant place to the discussion of chorèmes—schematic representations purified of all aspects that are irrelevant to the main structures or relationships within the geographic region, including geometric accuracy. Chorematic diagrams offer a means of constructing an abstract thematic model of a region.
- There is a new discussion, in Chapter 8, of the implicit presence of temporal components in maps, using fascinating example maps of Iceland’s airline flight networks.
- Chapter 9 features a significant reworking of the explanation of the principles of electronic atlases, with more focus on interactive web-based implementations.
- A discussion of geovisual analytics has been updated in Chapter 10, including a modern example of using an interactive analytical dashboard.
- The addition of useful information on the Creative Commons Licenses—often used to regulate the use of open data such as OSM—now rounds out the overview of copyright issues in cartography.
That fifty-four of the one hundred and forty-eight bibliographic references are new to this edition—thirty-five of them dating from 2010 or later—serves as one indication of the significant effort the authors made in bringing the methodological grounds of the book up to date.
Considering the scale of this effort, it is surprising that more attention was not paid to the all-too-briefly mentioned topic of 3D/VR/AR mapping—perhaps in Chapter 10. This is a rapidly developing area of geovisualization, where many questions about visualization and human-computer interaction are now being investigated.
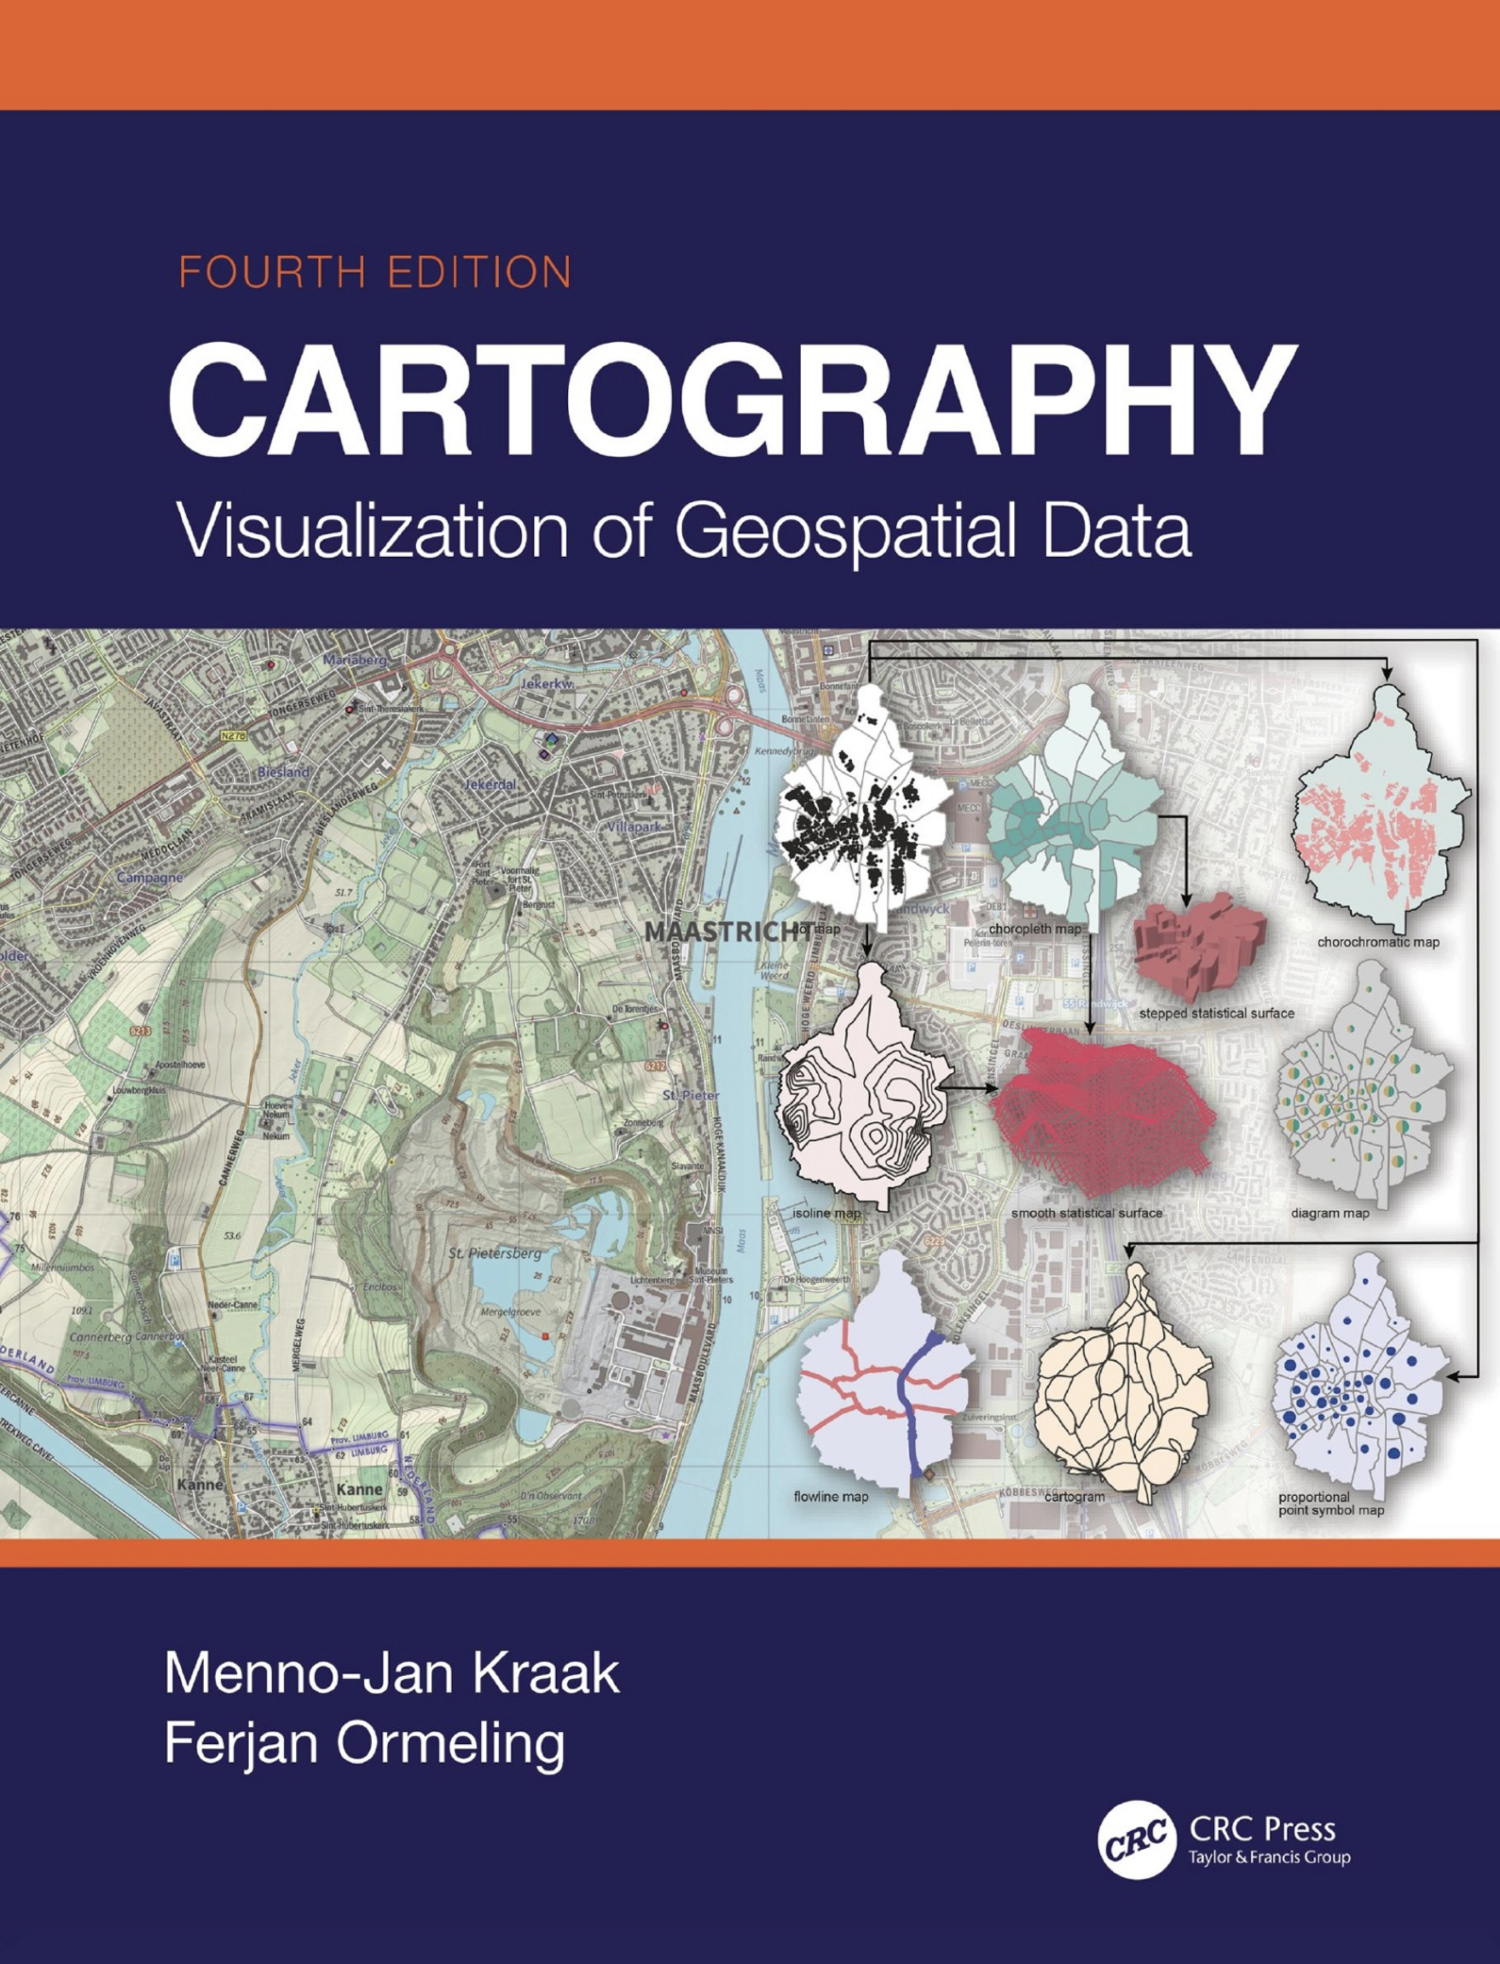
One of the greatest improvements of the current edition is in the quality of the figures. This edition of the book is the first to be printed in color throughout—and it is needless to say how crucially important this is for a cartography text. Not only are almost all figures now colorful, but they have also been redesigned with a more modern look. The drop shadows and gradients that figured so prominently in the 1990s figures have been removed, replaced by plain, minimalistic graphics. There is a better balance between schematic and photorealistic figure elements, and the typographic work is more substantial and rigorous—all of which results in a much more unified visual look and, consequently, a more pleasing reading experience. Printing the entire text in color allowed more than fifty figures to be moved from the separate color plate section into the body of the book, which facilitates a seamless interplay between the text and the illustrative material. Perhaps most importantly, color-related issues of map design and the depiction of topography on maps are now illustrated alongside their discussion in the text.
The authors have also taken the opportunity to employ updated and, in many cases, more timely and relevant map illustrations, taken from more widespread sources. For example, the 3D panoramic map visualization (Figure 9.4) was generated using a newer version of the Atlas of Switzerland (www.atlasofswitzerland.ch), while a figure illustrating multiscale topographic generalization (Figure 6.17) was created from OpenStreetMap, replacing the earlier one from Microsoft Encarta. Some of the images reflect the authors’ updated views on specific conceptual questions of cartography. For example, the earlier version of Figure 3.1 placed cartography and related research disciplines in a two-dimensional spatial-nonspatial/exploration-presentation dichotomy, but the figure now includes information graphics as a third related domain—along with scientific visualization and information visualization.
Pages have retained their two-column layout, and this—on the roughly A4/letter width pages—continues to provide an optimum reading line-length. The typeface, however, has been changed from good old (but pretty boring) Times to ITC Benguiat—a face that is probably a poor choice for typesetting a lengthy, content-heavy, volume such as academic textbook, as it is somewhat fancy and hard to consume in large amounts.
The updated layout now represents some lists as plain text, which I perceive as a downgrade in content readability. This can be seen by comparing the explanation of Jenks and Coulson’s classification approach as list on page 128 of the previous edition with its less explicitly delineated counterpart on page 157 of the new one (Figure 1).
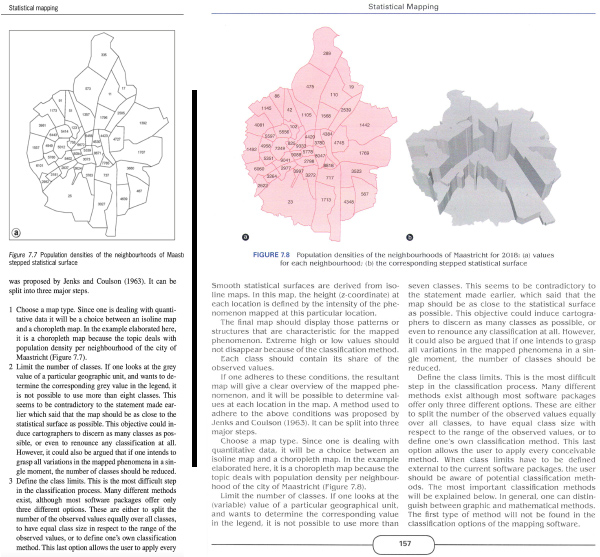
Figure 1. Explanation of Jenks and Coulson’s classification approach in the 3rd (left, half-page) and 4th (right, full-page) edition of the textbook.
Because the book’s overall structure remains unchanged, all the questionable and subjective aspects of the book’s arrangement and naming conventions remain unchanged as well. Any individual reader may chose to see this as a good thing or a bad thing, but there are at least some places where the authors’ line of thought on these matters remains unclear to me. For example, one wonders why the conceptually important, theoretically driven chapter on map characteristics is not the second chapter—right after the introduction to GIScience and maps. Instead, the two topics are separated by highly practical material on data acquisition; something arguably much closer to the issues of map design and production that are explained in the fifth chapter. Similarly, I cannot think of any justification for discussing vector file characteristics before introducing the vector data model (Chapter 2)—surely it is the model that determines what file characteristics are desirable. Not all chapters have equally well elaborated hierarchies of content. For example, although chapters 8 (“Mapping time”) and 10 (“Geovisualization”) are of similar length (12 and 10 pages respectively), the former is subdivided into four named sections while the latter contains only one.
How Kraak and Ormeling came to name of some the chapters, and their choices of material to place in them, is not always as evident as it might be. Chapter 4 is a notable example: entitled “GIS Applications: Which Map to Use,” the chapter in fact discusses the differences between maps of different scales, along with other possible map comparisons. What have “GIS Applications” to do with what would seem to be straightforward cartographic issues—topics clearly lying outside of any GIS context? The title of the final chapter of the book, “Cartography at Work: Maps as Decision Tools,” also seems somewhat misleading. It focuses not on the mechanisms for using maps as decision making tools, but rather on factors that affect the possibility and the reliability of such use—including various legal issues, data accessibility, relevance, and so on.
As in the previous editions, there are frequent references in Cartography: Visualization of Geospatial Data to specific software, websites, and contemporary cartographic products—an approach that makes it seem quite practical and down to earth, and rather less abstract and fundamental than one would expect in an academic cartography textbook. The authors, however, claim that their first objective was “to provide an overview of the role that maps will play both today and in the near future in the world of geospatial data handling” (ix), and from this point of view their engagement with the contemporary situation is quite justified. Data handling is a highly practical process that is heavily dependent on existing technological infrastructure, including the specific software products, and that infrastructure needs to be discussed despite the danger of specific information going out of date.
The authors acknowledge the teaching of map design and map function as the second and the third objectives of the book, and, while it is not a book specifically on map design, production and use, it explores these topics reasonably well.
Overall, the book makes generally positive impression. Its content fairly depicts the various sides of modern cartography, and has been brought up to date in almost every area it touches. This new edition is a significant improvement over the previous ones in terms of the quality of its graphics, which are now full color and are much more unified in style. The criticisms which I have outlined are relatively minor and subjective, and reflect only my own personal views. I am quite confident that the authors generally achieved their objectives with this edition of Cartography: Visualization of Spatial Data, and that it is worthy to be on the shelf of every modern academic researcher or teacher of cartography.
I would like to sincerely thank the editors of Cartographic Perspectives for their thorough and attentive comments, which helped to greatly improve the logic and wording of this review.