DOI: 10.14714/CP103.1919
© by the author(s). This work is licensed under the Creative Commons Attribution-NonCommercial-NoDerivatives 4.0 International License. To view a copy of this license, visit http://creativecommons.org/licenses/by-nc-nd/4.0.
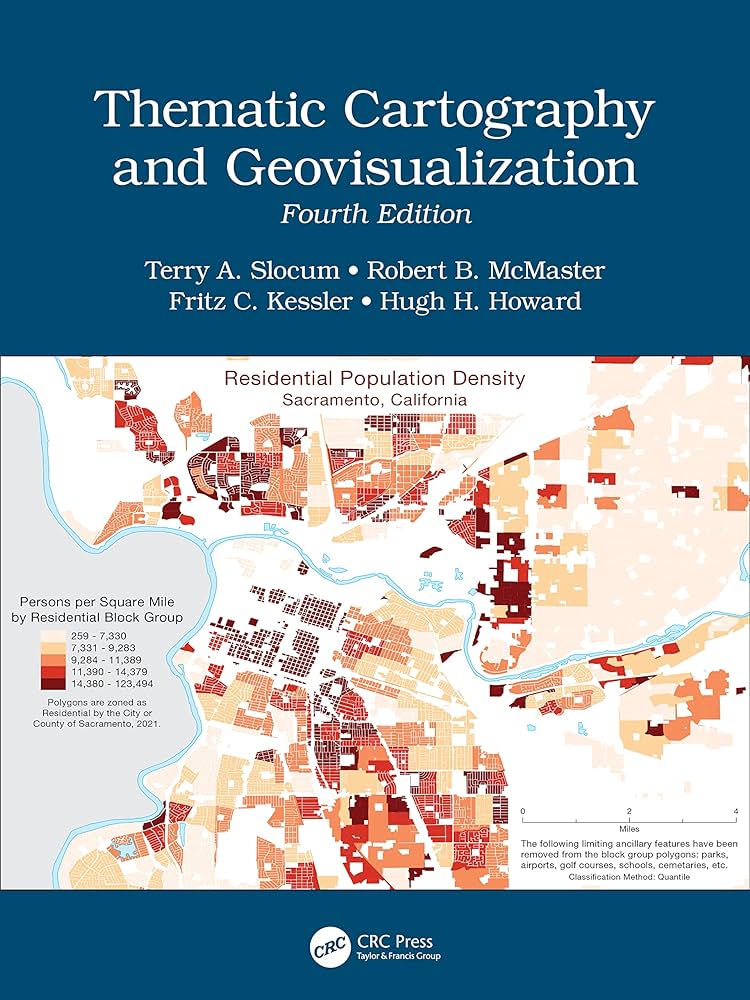
Review of Thematic Cartography and Geovisualization, Fourth Edition
By Terry A. Slocum, Robert B. McMaster, Fritz C. Kessler, and Hugh H. Howard
CRC Press, 2023
612 pages, with more than 400 maps, artwork, and diagrams
Hardcover: $180.00, ISBN 978-0-367-71270-9
eBook: $180.00, ISBN 978-1-00-315052-7
Review by: Daniel G. Cole, Smithsonian Institution
While I have not read a cartography textbook in several decades, I welcomed the chance to do so here, given the important advances that have taken place in cartography and geovisualization since the last edition of this textbook was published in 2008. The book is divided into twenty-eight chapters, grouped in three parts after Chapter 1: “Principles of Cartography,” “Mapping Techniques,” and “Geovisualization.” It is somewhat grandly stated, right at the beginning of the “Preface,” that
This comprehensive and well-established cartography textbook covers the theory and the practical applications of map design and the appropriate use of map elements. It explains the basic methods for visualizing and analyzing spatial data and introduces the latest cutting-edge data visualization techniques. (i)
The authors then go on to provide justifications for this new edition, including the rise of volunteered geographic information, big data, cloud cartography, story maps, and a variety of new hardware types. The “Preface” also notes the availability of both an e-book and a companion website, the latter with student and instructor resources, and answers to the chapters’ study questions (available to registered and verified course instructors on a password-protected Instructor Resources Download Hub). Lastly, the authors give suggestions on how the book can be used for either one- or two-semester classes.
Beginning with the first, “Introduction,” each chapter opens with an overview or introductory section, followed by a list of learning objectives, and then finishes with a summary section, study questions, and references. Unsurprisingly for a work entitled Thematic Cartography, thematic maps are addressed immediately in this first chapter, with a definition of what they are and how they are used. The authors illustrate their descriptions with both well and poorly designed examples of dot, proportional circle, choropleth, animated, and physiographic maps, and explanations of why, for example, using a rainbow color scheme on a choropleth map is generally considered bad practice (3, Fig 1.1). Other discussions in this chapter cover map communication, the consequences of recent technological changes in cartography, a definition of geovisualization, and a rundown of geoscience techniques, as well as an overview of some of the cognitive, social, and ethical issues in cartography.
Chapter 2, “A Historical Perspective on Thematic Cartography,” opens the “Principles of Cartography” part with a brief, illustrated history of cartography in general, followed by a history of thematic cartography that includes the rise of social cartography. The authors next take up academic cartography, dividing their narrative of this post-1900 phenomenon into four Periods. The history of Period 1 focuses on four leading practitioners active in the mapmaking field before World War II, and Period 2 focuses on three pioneering university programs that emerged after 1945. The development of alternative training forums in the 1970s and 80s is recounted in Period 3, “The Growth of Secondary Programs,” with specific mentions of ten such programs such as cartography at Syracuse University, to name just one. Finally, the integration of cartography with GIScience is identified as characterizing Period 4. The chapter finishes with discussions on European thematic cartography (specifically Swiss, British, and French), and what are termed the paradigms of American cartography, discussed under the headings of analytical cartography and of maps and society. The latter is broken down into the sub-paradigms of privacy, power and access, ethics, and public participation GIS/mapping.
The third chapter, “Statistical and Graphical Foundation,” is the only one devoted to spatial statistics. It begins with an explanation of the importance of differentiating between populations and samples, and between descriptive and inferential statistics, before moving on to methods that can be used for analyzing the distribution of both individual and multiple attributes using tables, graphs, and numerical summaries. The chapter finishes with discussions of exploratory data analysis and of numerical summaries for geographic data.
Chapter 4, “Principles of Symbolization,” succinctly covers the nature of a variety of geographic phenomena, including: spatial dimensions (points, lines, areas, and volumes); discrete and continuous models; levels of measurement (ordinal, interval, ratio, balanced, and unipolar); and visual variables for quantitative and qualitative phenomena. The authors continue with sections on comparing four common thematic mapping techniques (choropleth, proportional symbol, isopleth, and dot maps), on selecting from a variety of visual variables for choropleth maps, and on ways of using other senses (sound, touch, and smell) to interpret spatial patterns.
Chapter 5, “Data Classification,” begins by discussing when and why one might employ classed versus unclassed data. It then dives into the many standard classification techniques available, such as equal intervals, quantiles, mean-standard deviation, natural breaks, optimal median (including the Jenks-Caspall and Fisher-Jenks algorithms), and head/tail breaks classing methods. The discussion points out the advantages and disadvantages of each method, and ultimately outlines criteria for selecting a classification method and what to consider regarding data distribution.
Chapter 6, “Scale and Generalization,” lays out the differences between geographic and cartographic scales, and addresses the advantages and concerns encountered when using multi-scale databases. Generalization is discussed in its manual and digital domains, with the models of Robinson, Sale, and Morrison (1978) and McMaster and Shea (1992) analyzed. The need for clarity, and for relief from the congestion, coalescence, and conflict of map features, are why generalization is often required. Various operations of generalization are outlined with numerous examples and a few notes on relatively recent developments on how it might be approached.
The basic characteristics of the earth’s graticule—latitude, longitude, distance, and directions—are covered in Chapter 7, “The Earth and Its Coordinate System,” along with details of the earth’s size and shape. It is here that oblate spheroids, reference ellipsoids, graticules, geoids, and geodetic datums, and their relationship to thematic cartography, are succinctly examined.
Chapter 8, “Elements of Map Projections,” starts with the concept of projection, and touches upon related matters such as reference globes, developable surfaces, and the mathematics of projecting a globe to a map. The possible geometric classes (cylindrical, conic, and planar), cases (tangent and secant), and aspects (equatorial, oblique, and polar) of projections are covered. The general patterns of map distortion are discussed next, through visual appearance, scale factor, and Tissot’s indicatrix; the projection software Geocart is suggested for visualizing projection distortions. The final portion of the chapter concerns projection properties (area, angles, distances, and direction), how they are, strictly speaking, mutually exclusive, and how compromise projections can be a potential solution to balancing the strengths and weaknesses inherent in using purely equivalent or conformal coordinate systems.
Chapter 9’s advice for “Selecting an Appropriate Projection” is grounded in Snyder’s (1994) map projection guidelines for producing maps of the world, a hemisphere, a continent, or an ocean, and for preserving special properties, such as straight rhumb lines, straight line great circle routes, or (in specific instances) correct distances, and is illustrated with numerous examples. The authors finish by writing about using the Projection Wizard app to assist in selecting projections for static and web-based interactive maps. I was pleased to see this chapter broken out as a distinct topic, rather than simply being tacked on to Chapter 8. Given the range of projection-related problems I see in many maps from non-cartographer GIS users, it is clearly critical that projection selection have its own chapter in any “comprehensive and well-established cartography textbook” (i).
Chapter 10, “Principles of Color,” begins with how color is processed by the human visual system, and proceeds to explain five commonly used color models (RGB, CMYK, HSV, Munsell, and CIE), the terminology associated with each, and their practical uses. Color wheels, tints, shades, and tones are also discussed, as are the cartographic conventions for qualitative and quantitative color schemes, with the latter including sequential and divergent color ramps.
Chapter 11, “Map Elements,” is the first of three chapters concerned with the map as a composed graphic artifact. It starts with the graphic design principles of alignment, centering, balance, and the avoidance of visual noise; many of which are revisited in Chapter 13. Also covered are elements like the frame and neat lines, map area, inset, title and subtitle, legend, data citation, verbal and bar scales, map and page orientation, north arrow versus graticule use, and relative type sizes for various map elements. This last-mentioned topic leads directly to Chapter 12, “Typography,” which deals with the characteristics of type (face, family, style, size, weight, case, spacing, and kerning) and with line issues such as alignment and leading. Some of the standard North American map type usage conventions (for example, labeling natural features with serifed faces, and cultural features with sans-serif) are laid out, alongside specific guidelines for how labels should be placed in relation to point, line, and area features, as well as a discussion of aligning labels horizontally versus along with the graticule. The chapter closes with a discussion of the special concerns encountered with automated type placement.
Chapter 13, “Cartographic Design,” begins with discussions of the five step “map communication model” based on Shannon’s (1948) mathematical theory of communication, the history of map design research, the eight Gestalt principles, the seven step engineering design process (define, ask, imagine, plan, prototype, test, and improve), and the graphic principles of visual hierarchy, contrast, figure-ground, and balance. The rest of the chapter deals with a case study of the steps and procedures involved in designing an attractive, readable, and understandable real estate suitability map.
Chapter 14, “Map Reproduction,” appropriately starts with the advice to plan ahead. Among the points to consider are: your audience, budget, deadline, and printing material; if you will need to print in black & white or in color; the sheet size that will be required, if the final product will be folded or flat, whether you will print on only one or on both sides, and what print quality is achievable; and last, but not least, copyright. This is followed by sections on map editing, raster image processing, screening for print reproduction, aspects of color printing, and specialized matters connected with high-volume print reproduction that may or may not apply when delivering a map for publication by a third party.
The second part of the text, “Principles of Cartography,” begins with Chapter 15, “Choropleth Mapping,” and opens with advice on the selection of appropriate data for enumeration districts, and a recommendation to standardize raw data before use. There is also advice about selecting a color scheme, systems for specifying the colors in those schemes, and approaches appropriate for classed and unclassed choropleths. Completing the chapter are sections on legend design and illuminated choropleth mapping.
Some basic approaches to use for dasymetric mapping are discussed in Chapter 16, “Dasymetric Mapping,” with particular attention on selecting appropriate data and ancillary information. The authors highlight the studies by Eicher and Brewer (2001) and Mennis and Hultgren (2006) on intelligent dasymetric mapping (IDM), plus details on two more possible approaches for producing dasymetric maps of population density: mapping landcover, and the use of zoning polygons, while limiting ancillary data sets for both. SocScape: mapping residential segregation and racial diversity, a web based data and geo-app site created by Dmowska, Stepinski, and Netzel (2017) is summarized as well, although the URL given in the text is no longer working. The chapter is completed with discussions on mapping global population distribution via Gridded Population of the World (GPW), LandScan, and Global Human Settlement Layer projects.
Chapter 17, “Isarithmic Mapping,” deals with selecting appropriate data with the assumption that its output will be continuous and smooth. Further to that goal, there are sections on manual and automated interpolation, with the latter covering triangulation, inverse-distance weighting, kriging, thin-plate splines, and advice on choosing amongst the interpolation methods. The authors single out Tobler’s (1979) pycnophylactic, or volume-preserving, interpolation as “a more sophisticated approach for handling conceptual point data” (321). They finish the chapter with an analysis of isarithmic symbolization schemes: contour lines, continuous-tone maps, fishnet maps, and the color-stereographic effect as discussed by Eyton (1990).
Chapter 18 on proportional symbols outlines how to match data with the appropriate type of proportional symbols (pictographic or 2D and 3D geometric), noting the advantages and disadvantages inherent in each. The scaling of proportional symbols (mathematical, perceptual, or range-graded scaling) is discussed, as is the question of whether proportional symbol legends should be nested or linearly orientated, and whether they should adhere to range-graded sizes as determined by Meihoefer’s (1969) perceptual study or by Dent’s (1999) practical experience. The handling of unclassed versus classed symbols and how to deal with overlapping symbols is addressed as well. The chapter finishes with an evaluation of the necklace maps developed by Speckmann and Verbeek (2010). These last are a type of proportional symbol map that displaces the symbols, sometimes called beads, along a curve surrounding the map’s geographic area of interest.
Chapter 19 investigates the key issues in creating dot maps: determining dot size, value, distribution (uniform, geographically weighted, or geographically based to reflect realism), and manual versus digital placement. Should the legend equate a single dot with a single value, or should it display samples of significant densities? The text discusses both possibilities. Graduated dot maps are also presented, with an example employing three sizes of dots. Interactive dot maps are addressed through an evaluation of Walker’s (2018) Educational Attainment in America online map. Readers should note that the URL in the book takes them to a map of Hawaii, while the example in the book is of San Francisco, and the urban examples given on the website are of five other urban areas, none of which are San Francisco or in Hawaii.
Chapter 20 addresses the most common forms of cartograms (distance, value-by-area, univariate, and bivariate). The authors analyze attempts to preserve shapes with contiguous, non-contiguous, gridded, and mosaic cartograms, as well as other methods that do not preserve shapes, such as rectangular, Dorling, and Demers cartograms. The accuracy of each of these disparate cartogram methods is discussed, supported by a user study of how accurately each type is read. The chapter ends with consideration of some alternatives to cartogram methods, including: combined choropleth/proportional symbol maps, value-by-area maps, and balanced cartograms. Arguably, this last alternative, introduced by Harris et al. in 2017, may be the easiest to read and interpret.
Chapter 21, “Flow Mapping,” starts with the three main types of flow maps (origin-destination, trajectory-based, and continuous) and the six flow map design issues as identified by Dent, Torguson, and Hodler (2009):
Flow lines have the highest intellectual importance and thus should be placed at the top of the visual hierarchy on the map. Smaller flow lines should appear on top of larger flow lines. Arrows should be used if the direction of flow is critical to the map meaning. Care should be taken in selecting a map projection appropriate for flow mapping. . . If data permits, flow lines should be placed such that the map appears balanced. . . Legends should be unambiguous and include units where necessary. (379)
The evolution of flow mapping is illustrated with two examples of flow maps created before automation, three examples of early digital efforts by Tobler, and several recent examples of digital flow mapping by Stephen and Jenny (2017), Koylu and Guo (2017), Koylu, Tian, and Windsor (2021), and Yang et al. (2019). Finishing this chapter is an evaluation of the geovisual analytics of flow maps via an integration of 2D maps with 3D space-time cubes.
Chapter 22, “Multivariate Mapping,” begins with bivariate mapping; comparing choropleth maps, miscellaneous thematic maps, and maps showing data for two points in time. This leads into an exploration of the combination of two variables on the same choropleth map, and then to additional bivariate mapping techniques. Multivariate techniques elucidated include multiple map comparisons, multiple colored dot maps, and other multivariate point symbol maps, including ray-glyphs or stars, polygon glyphs or snowflakes, 3D bars, data jacks, Chernoff faces, and ring maps. The chapter ends with several pages on the basic steps for making multivariate maps and for adding a contiguity constraint in hierarchical cluster analysis.
The third part, “Geovisualization,” begins with Chapter 23, “Visualizing Terrain.” Here, the authors start off with techniques to represent data or elevation surfaces (hachures, contour-based methods, Raisz’s physiographic method, shaded relief, and morphometric techniques). They follow up with analyses of oblique views (block diagrams, panoramas, and plan-oblique relief), physical models, and details involved in creating shaded relief: generalization, selecting azimuth and sun elevation, contrast, Swiss-style drawing, and colors for hypsometric tints.
Chapter 24, “Map Animation,” quickly covers the early developments in map animation tools, followed by definitions of the pertinent motion/visual variables (duration, rate of change, order, display date, frequency and synchronization). Among the examples of temporal animation are: movement and flows, animated choropleth maps and the issues involved, proportional symbol maps, isarithmic maps, and bubble plots. Nontemporal animations are represented by some early works by Peterson (1993; 1999) and Gershon (1992), fly-overs, plus Viegas and Wattenberg’s Wind Map. These examples lead into a discussion of ways to enhance interactivity in animations, with reference to the work of researchers such as Harrower, MacEachren, and Griffin (2000), Harrower (2002), and CoronaViz by Samet et al. (2020). After rhetorically asking if animations really work, the authors conclude that more research is necessary to make them effective. They wrap up the chapter by providing a set of eight guidelines for producing animations, and a closing section on using 3D space for displaying temporal data.
“Data Exploration” is the title of Chapter 25. It starts with a discussion of the goals and methods of data exploration, and proceeds to an analysis of how nine data exploration software applications (Moellering’s 3D mapping software, ExploreMap, Project Argus, MapTime, CommonGIS, GeoDa, Micromaps, ViewExposed, and Tableau) measure up in applying the methods to achieve those goals.
In Chapter 26, “Geovisual Analytics,” the authors take up the question on everyone’s lips: What is geovisual analytics? They answer by diving into the characteristics and limitations of big data; the concept of the Self-Organizing Map (SOM) as developed by Skupin and Agarwal (2008); and a description of five examples of geovisual analytics: TaxiVis, Mosaic Diagrams, CarSenToGram, Crowd Lens, and SOM.
Chapter 27, “Visualizing Uncertainty,” begins with the basic elements of uncertainty (MacEachren et al. 2005), and goes on to address the general methods and visual variables appropriate for the depiction of uncertainty, including the use of Tissot’s indicatrix and MacEachren’s dimensions of clarity (crispness versus fuzziness), resolution, and transparency. Appropriate situations for the employment of uncertainty visualization include: choropleth class breaks, the use of SAAR (Spatial Analysis using ArcGIS Engine and R) software, climate change, decision making for water balance and hurricanes, along with some examples of interactivity and animation. Sound can also be used to depict data uncertainty, and the authors cite thirteen sound dimensions as identified by Ballatore, Gordon, and Boone (2019), but note that the cited article did not involve a spatial component, and is thus only a first step towards cartographic use.
Chapter 28, “Visual Environments and Augmented Reality,” completes the textbook, first by defining the terms visual environment (VE) and augmented reality (AR), describing the four “I” factors of VEs (immersion, interactivity, information intensity, and intelligence of objects), and surveying the many forms that hardware for such systems can currently take: personalized displays (head-mounted and desktop) and room-size, wall-size, and drafting table displays (GeoWall, CAVE, and ImmersaDesk). Having thus described the lay of the VE/AR land, the authors identify four key questions to be addressed: Are specialized symbols necessary for thematic maps created in VE? Are stereoscopic maps more effective than non-stereoscopic maps? What are some examples of VEs that make use of CAVES and wall-size displays? and What progress has been made toward developing a digital earth? They jump to some recent examples of AR use including: the AR Sandbox, using AR to enhance understanding of topographic maps, developing novel methods for interacting with AR environments, and holograms. A discussion of health, safety, and social issues (such as cybersickness) that can arise when using VEs and AR rounds out the chapter.
The tome is completed with a twenty-page glossary and a twelve-page index.
My quibbles with the fourth edition of Thematic Cartography and Geovisualization are few, and uniformly minor. An example of one, a typo that occurs in several other places as well, appears on page 26: a website URL with the “s” missing after “http.” Another complaint concerns where the authors note, on page 30, that Goode’s World Atlas is now available in its twenty-first edition. A quick web search reveals that the twenty-third edition had, in fact, appeared before this book was published. I also note the occasional dead or misdirected web link that crops up here and there throughout the text, but it could be argued that such issues are endemic when hardcopy books cite dynamic internet sources.
I recently heard from one of the authors (Kessler, in a personal communication, 2024) that Thematic Cartography and Geovisualization is more popular in Europe than it is in the United States; something I have a hard time understanding. Overall, to my mind, this impressive book stands far above any other cartographic textbook available. I recommend it as required reading for every GIS/cartographic program across academia. At a list price of $180 (though it can be found for less), this is not an inexpensive textbook; but considering that it can, or should, be used for two quarters or semesters of classwork and will remain a rich and relevant resource of cartographic and geovisualization knowledge for some years to come, it is a worthwhile investment. While the cost may be prohibitive for some, it is available in eBook format for 10% less at times; and, in both electronic and paper format, it gives students and instructors access to valuable online resources.
REFERENCES
Ballatore, Andrea, David Gordon, and Alexander P. Boone. 2019. “Sonifying Data Uncertainty with Sound Dimensions.” Cartography and Geographic Information Science 46 (5): 385–400. https://doi.org/10.1080/15230406.2018.1495103.
Dent, Borden D. 1999. Cartography Thematic Map Design, Fifth Edition. Boston, MA: McGraw-Hill.
Dent, Borden D., Jeffrey S. Torguson, and Thomas W. Hodler. 2009. Cartography: Thematic Map Design, Sixth Edition. Boston, MA: McGraw-Hill.
Dmowska, Anna, Tomasz F. Stepinski, and Pawel Netzel. 2017. “Comprehensive Framework for Visualizing and Analyzing Spatio-Temporal Dynamics of Racial Diversity in the Entire United States.” PLoS ONE 12 (3): e0174993. https://doi.org/10.1371/journal.pone.0174993.
Eicher, Cory L., and Cynthia A. Brewer. 2001. “Dasymetric Mapping and Areal Interpolation: Implementation and Evaluation.” Cartography and Geographic Information Science 28 (2): 125–138. https://doi.org/10.1559/152304001782173727.
Eyton, J. Ronald. 1990. “Color Stereoscopic Effect Cartography.” Cartographica 27 (1): 20–29. https://doi.org/10.3138/K213-2288-7672-U72T.
Gershon, Nahum. 1992. “Visualization of Fuzzy Data Using Generalized Animation.” Proceedings, Visualization ’92, Boston, MA, 268–273. https://doi.org/10.1109/VISUAL.1992.235199.
Harris, Richard, Martin Charlton, Chris Brunsdon, and David Manley. 2017. “Balancing Visibility and Distortion: Remapping the Results of the 2015 UK General Election.” Environment and Planning A 49 (9): 1945–1947. https://doi.org/10.1177/0308518X17708439.
Harrower, Mark. 2002. “Visual benchmarks: Representing Geographic Change with Map Animation.” Ph.D. diss., The Pennsylvania State University.
Harrower, Mark, Alan MacEachren, and Amy L. Griffin. 2000. “Developing a Geographic Visualization Tool to Support Earth Science Learning.” Cartography and Geographic Information Science 27 (4): 279–293. https://doi.org/10.1559/152304000783547759.
Koylu, Caglar, and Diansheng Guo. 2017. “Design and Evaluation of Line Symbolizations for Origin-Destination Flow Maps.” Information Visualization 16 (4): 309–331. https://doi.org/10.1177/1473871616681375.
Koylu, Caglar, Geng Tian, and Mary Windsor. 2021. “FlowMapper.org: A Web Based Framework for Designing Origin-Destination Flow Maps.” Journal of Maps 19 (1): 1996479. https://doi.org/10.1080/17445647.2021.1996479.
MacEachren, Alan M., Anthony Robinson, Susan Hopper, Steven Gardner, Robert Murray, Mark Gahegan, and Elisabeth Hetzler. 2005. “Visualizing Geospatial Information Uncertainty: What We Know and What We Need to Know.” Cartography and Geographic Information Science 32 (3): 139–160. https://doi.org/10.1559/1523040054738936.
McMaster, Robert G., and K. Stuart Shea. 1992. Generalization in Digital Cartography. Resource Publications in Geography. Washington, DC: Association of American Geographers.
Meihoefer, Hans-Joachim. 1969. “The Utility of the Circle as an Effective Cartographic Symbol.” The Canadian Cartographer 6 (2): 105–117. https://doi.org/10.3138/J04Q-1K34-26X1-7244.
Mennis, Jeremy, and Torrin Hultgren. 2006. “Intelligent Dasymetric Mapping and its Application to Areal Interpolation.” Cartography and Geographic Information Science 33 (3): 179–194. https://doi.org/10.5194/essd-14-2833-2022.
Peterson, Michael P. 1993. “Interactive Cartographic Animation.” Cartography and Geographic Information Systems 20 (1): 40–44. http://doi.org/10.1559/152304093782616724.
———. 1999. “Active Legends for Interactive Cartographic Animation.” International Journal of Geographic Information Science 13 (4): 375–383. https://doi.org/10.1080/136588199241256.
Robinson, Arthur H., Randall D. Sale, and Joel L. Morrison. 1978. Elements of Cartography, Fourth Edition. New York: Wiley.
Samet, Hanan, Yunheng Han, John Kastner, and Hong Wei. 2020. “Using Animation to Visualize Spatio-Temporal Varying COVID-19 Data.” In 1st ACM SIGSPATIAL International Workshop on Modeling and Understanding the Spread of COVID-19, Seattle, WA, 53–62. https://doi.org/10.1145/3423459.3430761.
Shannon, Claude Elwood. 1948. “A Mathematical Theory of Communication.” Bell System Technical Journal 27 (3): 379–423. https://doi.org/10.1002/j.1538-7305.1948.tb01338.x.
Skupin, André , and Pragya Agarwal. 2008. “Introduction: What is a Self-Organizing Map?” in Self-Organizing Maps: Applications in Geographic Information Science, edited by P. Agarwal and A. Skupin, 1–20. Chichester, UK: John Wiley. https://doi.org/10.1002/9780470021699.ch1.
Snyder, John P. 1994. Map Projections: A Working Manual. Washington, DC: US Government Printing Office. https://doi.org/10.3133/pp1395.
Speckmann, Bettina, and Kevin Verbeek. 2010. “Necklace Maps.” IEEE Transactions on Visualization and Computer Graphics 16 (6): 881–889. https://doi.org/10.1109/TVCG.2010.180.
Stephen, Daniel M., and Bernhard Jenny. 2017. “Automated Layout of Origin-Destination Flow Maps: U.S. County-to-County Migration 2009-2013.” Journal of Maps 13 (1): 46–55. https://doi.org/10.1080/17445647.2017.1313788.
Tobler, Waldo R. (1979) “Smooth Pycnophylactic Interpolation for Geographical Regions.” Journal of the American Statistical Association 74 (367): 519–536. https://doi.org/ 10.1080/01621459.1979.10481647.
Walker, Kyle .E. 2018. “Scaling the Interactive Dot Map.” Cartographica 53 (3): 171–184. https://doi.org/10.3138/cart.53.3.2017-0021.
Yang, Yalong, Tim Dwyer, Bernhard Jenny, and Kim Marriott. 2019. “Origin-Destination Flow Maps in Immersive Environments.” IEEE Transactions on Visualization and Computer Graphics 25 (1): 693–703. https://doi.org/10.1109/TVCG.2018.2865192.