DOI: 10.14714/CP77.1235
Sea Level Rise Maps: How Individual Differences Complicate the Cartographic Communication of an Uncertain Climate Change Hazard
David P. Retchless, The Pennsylvania State University | dpr173@psu.edu
ABSTRACT
Interactive, online maps of sea level rise have great potential for communicating climate change, as evidenced by both their popularity and likely ability to combat discounting of climate change hazards. However, little is known about how different audiences will interpret the significant uncertainties—including those related to the amount, timing, and spatial coverage of sea level rise flooding—communicated on many of these maps. A review of the risk perception literature presents three situations where different aspects of uncertainty have been suggested to dictate (or at least strongly encourage) adaptive or mitigative action in the context of sea level rise or similarly uncertain hazards, then problematizes these accounts by showing how context and personal differences mediate (and in some cases reverse) these expected relationships. A final section offers preliminary reflections on the implications for the cartographic communication of climate change and sea level rise uncertainty.
KEYWORDS: sea level rise; uncertainty; individual differences; climate change; interactive online map
INTRODUCTION
Maps have great potential for communicating climate change (Deitrick and Edsall 2009), and of the many ways of mapping climate change, maps of sea level rise may be one of the most popular (Preston et al. 2011) and powerful (Monmonier 2008) for reaching a general audience. Maps may be more familiar and comprehensible to novice users than graphs and other ways of visualizing climate change (Schnotz 2002), and have been shown to be more engaging than text alone for communicating climate change information (Retchless 2014). Sea level rise is a popular topic on climate change maps. Preston et al. (2011) found that sea level rise was one of the more popular topics on academic maps of climate change vulnerability, and of the 25 online, interactive water level visualization tools studied by Roth et al. (in press), 21 include depictions of sea level rise. Evidence suggests that these maps are not only widely available, but may also be one of the more frequently sought after types of climate change map. According to a Google Trends analysis for 2007 to 2014, searches for “sea level rise map” have been almost as frequent as searches for the more general “climate change map,” and are becoming more popular (see Lang [2014] for a discussion of how Google Trends can be used to assess Internet users’ information seeking behavior). During May 2014, the Trends analysis shows that searches for “sea level rise map” spiked to more than twice the highest previously recorded level for either search term (Figure 1).
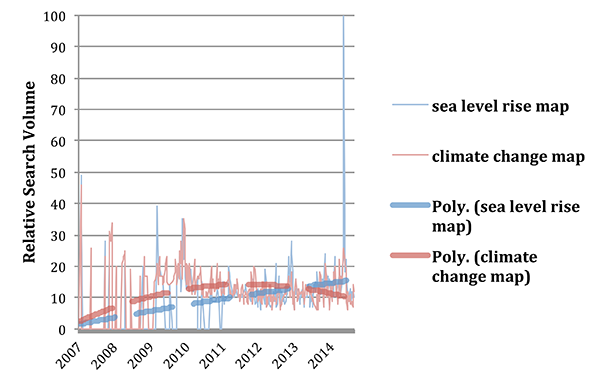
Figure 1: Weekly Google Trends comparison of the relative search volumes for the terms “sea level rise map” and “climate change map,” including second degree polynomial trend lines. A score of 100 indicate the highest search volume in the dataset. Search volumes for sea level rise maps have been increasing, and recently spiked to more than twice their previous highest value. This spike may have been driven by increased interest in sea level rise following widespread media coverage of a study predicting the collapse of part of the West Antarctic Ice Sheet (Joughin et al. 2014).
With their increasing popularity, sea level rise maps have gathered a diverse set of producers and users, potentially complicating the communication of this already complex and uncertain hazard. As described in Roth et al. (in press), government agencies, non-profits, universities, private-industries, and news organizations have all produced interactive, online sea level rise maps in recent years. Academics have also been active in the production of non-interactive maps of sea level rise vulnerability for at least 15 years (see review in Preston et al. 2011). Audiences for sea level rise maps are similarly diverse, including scientists, policymakers, bureaucrats, educators, and, increasingly, members of the general public (Monmonier 2008; Kostelnick et al. 2013). Designing maps that clearly communicate both the sea level rise hazard and its uncertainty to users with multiple levels of domain and map-user expertise is a significant and important challenge (Kostelnick et al. 2013).
This article explores the advantages and challenges associated with using the increasingly popular medium of sea level rise maps for communicating climate change. It first discusses how, by displaying impacts that are local and tangible, sea level rise maps may be less likely than other depictions of climate change to promote discounting, and therefore more engaging. Next, it identifies the significant uncertainties associated with sea level rise mapping and describes how they can pose challenges to climate change communicators—particularly given the complex ways in which these uncertainties may interact with individual differences to affect how audiences understand and evaluate the sea level rise hazard. A final section offers general considerations for the design of sea level rise maps in light of these advantages and challenges.
ADVANTAGES OF SEA LEVEL RISE MAPS: COMBATING DISCOUNTING
The popularity of sea level rise maps may be related to their ability to make the global, complex, and chronic hazards of climate change local, tangible, and personally meaningful. The climate change communication literature suggests that such a transformation can be challenging. Surveys of US residents have found that while most are interested in learning more about climate change, they also believe it will affect others more than themselves, and therefore may not be inclined to take action to address the issue (Maibach et al. 2009). Such discounting leads many to downplay the personal importance of climate change hazards, believing that any negative impacts will primarily be felt in the distant future, by people who live far away, or by the non-human natural world (Nicholson-Cole 2005; Leiserowitz 2007; Lorenzoni et al. 2007; Swim et al. 2009). Given the culturally and politically charged state of discussions about climate change, discounting may also be used (as part of motivated reasoning) to dismiss beliefs about climate change hazards that are inconsistent with one’s worldviews or political brand (Kahan et al. 2011).
Several features of online sea level rise maps may diminish this discounting. To illustrate these features, this paper uses two of the more popular examples of online sea level rise maps: NOAA’s Sea Level Rise and Coastal Flooding Impacts Viewer (coast.noaa.gov/digitalcoast/tools/slr, Figure 2) and Climate Central’s Surging Seas (sealevel.climatecentral.org, Figure 3). First, these maps make sea level rise local, displaying it at the level of neighborhoods and city blocks, and making clear that—at least for residents of coastal areas—the sea level rise hazard is one that will likely strike close to home. This perspective casts sea level rise as a potential threat to one’s identity as a member of the local community, potentially discouraging discounting and weakening the role of broader political and cultural commitments in shaping beliefs about climate change (Kahan et al. 2013). Monmonier (2008, 67) predicted the power of such a local perspective, claiming that large-scale maps that show sea level rise on top of local road networks “could be a powerful message for coastal residents,” particularly if published in an interactive, online format. Second, the maps make sea level rise tangible. For example, the NOAA map displays not only the extent of inundated land, but also provides clickable placemarks that use pictures to simulate what sea level rise flooding might look like at several local landmarks. Similarly, the Climate Central map shows the locations of local schools, police stations, and other critical infrastructure that may be threatened by sea level rise. These depictions of flooding of well-known places make clearly visible the effects of climate change, which are often diffuse, difficult to observe directly, and emerge only through analysis of trends and averages over large temporal and spatial scales (Hawkins and Sutton 2009; Moser 2010). Third, these online maps make sea level rise personally relevant. The pan-and-zoom interfaces encourage map users to explore and zoom in on locations that are personally meaningful, whether in their own hometowns, favorite vacation destinations, or places of symbolic importance. As argued by Bostrom et al. (2008), such interactive features can allow users to customize hazard maps to suit their needs and interests, facilitating personal engagement with the sea level rise information.
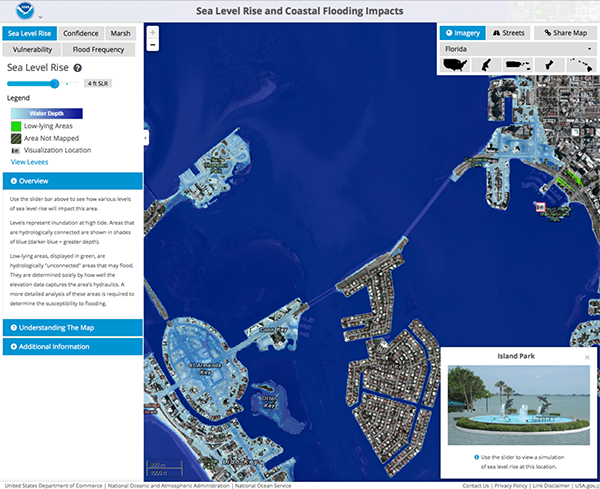
Figure 2: NOAA’s Sea Level Rise and Coastal Flooding
Impacts Viewer.
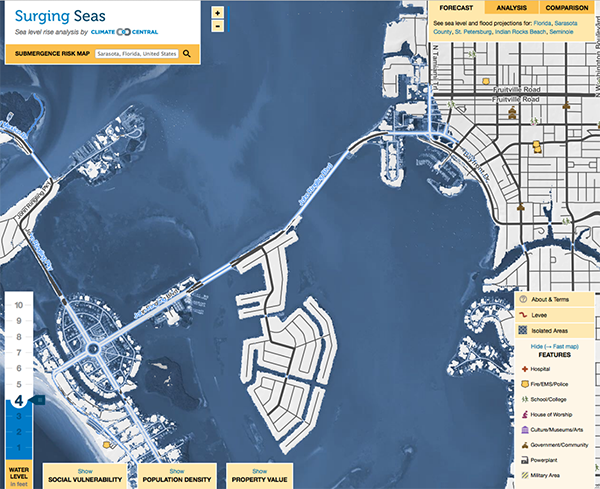
Figure 3: Climate Central’s Surging Seas.
CHALLENGES OF SEA LEVEL RISE MAPS: COMMUNICATING UNCERTAINTY
Although online interactive sea level rise maps may hold great potential for communicating climate change, at least one feature of these maps may prove challenging for some audiences: their depiction of the multiple, interacting uncertainties that are inherent to the sea level rise hazard. This section reviews three perspectives on sea level rise uncertainty—two from cartography and one from economics and decision sciences—and applies them to NOAA’s Sea Level Rise and Coastal Flooding Impacts Viewer. It then considers cartographic depictions of sea level rise uncertainty from the user perspective, concluding with examples of three ways in which individual differences may affect map users’ understanding of and responses to uncertain sea level rise information.
THREE PERSPECTIVES ON SEA LEVEL RISE UNCERTAINTY
While authors from many different academic disciplines have considered sea level rise uncertainty, perspectives from two disciplines—cartography and GIScience, and the economic and decision sciences—are particularly relevant to this discussion of how maps can promote sea level rise awareness, engagement, and action. Perspectives from the cartographic and GIScience literature emphasize the components of sea level rise information that may be uncertain (Kostelnick et al. 2013) and the types of uncertainty that may be associated with these information components (Roth et al. in press), while perspectives from the economic and decision sciences tend to emphasize the level of precision in the measurement or expression of these types of uncertainty (Willows et al. 2003). This list is not exhaustive. For example, from a modeling and prediction perspective, sources of uncertainty—such as unknowns concerning future economic development pathways and associated greenhouse gas emissions—are often an important consideration (Dessai and Hulme 2004; Hawkins and Sutton 2009). Although the discussion below occasionally mentions sources of uncertainty, it focuses on how the three perspectives from cartography/GIScience and the economic and decision sciences have been used to study sea level rise communication.
UNCERTAINTY IN THE COMPONENTS OF SEA LEVEL RISE INFORMATION
In the sea level rise context, the two cartographic/GIScience perspectives have generally been used to explore how elements of map design such as visual variables and map interaction can be used to communicate uncertainty. Kostelnick et al. (2013) consider how visual variables and map interaction are used on sea level rise maps to communicate uncertainty related to the spatial, temporal, and attribute (framed as “natural process”) components of geographic information, noting that MacEachren (1992) identified these three components as essential to uncertainty representation. These components of sea level rise information accrue uncertainty from several sources. Uncertainties about future emission pathways and oceanic/atmospheric response introduce significant attribute and temporal uncertainty: how much will sea levels rise, and when (IPCC 2013)? Moreover, digital elevation models and tidal transformations introduce spatial uncertainty into any mapping of a specific amount of sea level rise (NOAA 2010). Kostelnick et al. (2013) describe how maps can communicate attribute and temporal uncertainty by presenting multiple scenarios for the amount of sea level rise at a specific time period (e.g., small multiples depicting low, medium, and high sea level projections for 2100). For communicating spatial uncertainty, Kostelnick et al. suggest either implying uncertainty in future shoreline position using techniques such as vignettes (an example of the visual variable focus); or limits on the ability to zoom-in on interactive maps; or explicitly representing this uncertainty by using different raster fills to show areas that are slightly above or below the projected inundation level.
Additional research may be needed to explore which types of cartographic interaction are best suited to representing uncertainties in the spatial, temporal, and attribute components of sea level rise information. As noted by MacEachren et al. (2005) and detailed by Roth (2013), the effectiveness of visual variables for representing uncertainty has been widely explored, but comparable work matching interaction techniques to the communication of these uncertainties has been lacking.
UNCERTAINTY TYPES ASSOCIATED WITH COMPONENTS
Deploying the second cartographic/GIScience perspective on sea level rise uncertainty, Roth (2009b; in press) has considered how different types of uncertainty are used in inundation mapping. The uncertainty types considered in both studies are drawn from MacEachren et al. (2005), who present nine ways in which geospatial information may be uncertain: accuracy/error, precision, completeness, consistency, lineage, currency, credibility, subjectivity, and interrelatedness. MacEachren et al. (2012) simplify this list, retaining accuracy/error and precision as separate types but grouping the remaining seven, more “subjective” types of uncertainty into the collective type of “trustworthiness.” Roth (2009b) performed a qualitative assessment of the appropriateness and influence of all nine uncertainty types for floodplain mapping, which is similar to sea level rise mapping in its concern with delineating “hypothetical supplementary shorelines,” but differs in its authoritativeness, audience, uses, and scale (Monmonier 2008, 49). He found that experts in floodplain mapping considered all nine types appropriate, with accuracy/error, precision, and currency considered particularly influential for decision making. Meanwhile, Roth et al. (in press) considers how the nine different types of uncertainty are communicated using visual variables in a collection of 25 interactive, online sea level rise maps. He finds that only seven of the maps use the visual variables to represent one of the uncertainty types, that the only uncertainty types represented are completeness and “confidence” (which he considers similar to trustworthiness), and that only one map (the NOAA Viewer) represents both types. When these uncertainty types are represented, some combination of grain and color value are used to represent completeness, while the dimensions of color (hue, value, and saturation) are used for representing confidence.
While not dealing specifically with sea level rise, MacEachren et al. (2012) suggest that combining these two cartographic perspectives could inform the selection of visual variables for representing uncertainty. When combined, these two perspectives describe both what is uncertain (location, time, or attribute) and how or in what manner it is uncertain (in terms of accuracy, precision, or trustworthiness). MacEachren et al. (2012) show that visual metaphors for each combination of the “what” and the “how” of uncertainty can inform the design of iconic symbols for these combinations, and test the intuitiveness of these symbols in a user study. A similar study could extend this research by considering what symbols map users find most intuitive for the nine possible combinations of “what” and “how” of uncertainty on sea level rise maps.
LEVEL OF PRECISION IN THE MEASUREMENT OR EXPRESSION OF UNCERTAINTY TYPES
From the perspective of the economic and decision sciences, uncertainty in sea level rise and climate change is often considered in terms of its level of precision in measurement or expression, which is seen as a key factor in decision making. In their exploration of climate adaptation under uncertainty, Willows et al. (2003) contrast the process of decision making under precise uncertainty—as in games of chance and other situations where outcomes and consequences can be assigned probabilities and considered quantitatively—with decision making under imprecise uncertainty, where these probabilities are unknown or unknowable and therefore more amenable to qualitative analysis. Following a distinction first made in the economics literature by Knight (1921), these two conditions are commonly referred to as decision making under risk and decision making under uncertainty, respectively. In the climate change context, such conditions where uncertainty is not quantified, bounded, or defined have also been referred to as “deep uncertainty” (Kandlikar et al. 2005; Moser 2005). Bankes (2002) claims that this, too, has roots in economics, with the term “deep uncertainty” first used in this context by economist Kenneth Arrow in a talk on the Economics and Integrated Assessment of Climate Change offered at the Pew Center Workshop in 1999. Willows et al. (2003) argue that when precise probabilities cannot be assigned to decision outcomes for climate adaptation, decision makers’ choice of adaptation strategy will be highly dependent on subjective factors such as the heuristics they deploy and their attitude towards the risk. Kandlikar et al. (2005) identify several such factors that may bias risk perception when probabilities are imprecise, including ambiguity aversion, conflict aversion, and ignorance aversion. Similarly, Moser (2005, 364) suggests that sea level rise policymaking and management under deep uncertainty are sensitive to “values, cognitive processes, and attitudes.”
Much of this work has focused on how to describe and communicate these deep uncertainties to the public and decision makers. In an approach subsequently adopted by the Intergovernmental Panel on Climate Change (IPCC) for its Fifth Assessment Report (Mastrandrea et al. 2010), Kandlikar et al. (2005) suggest communicating uncertainties based on the precision with which they are known. They identify six levels of precision, with each matched to a different communication strategy. These levels range from situations where probabilities are well known and depiction using a full probability density function is appropriate; to less precisely known probabilities that are best described in terms of bounds, orders of magnitude, or the expected sign or trend direction; to states of effective ignorance, where quantitative descriptions are inappropriate and should be replaced with qualitative discussion of the available evidence and level of agreement (Kandlikar et al. 2005; Mastrandrea et al. 2010).
Researchers have yet to consider how these levels of precision might apply to the types of uncertainty identified by MacEachren et al. (2005). Of the nine types, accuracy/error and precision seem well suited to more precise levels of numeric expression, while the seven other types (grouped together as trustworthiness) seem likely to be more subjective, less precisely understood, and therefore communicated more qualitatively. Roth (2009a, 36) hints at this, noting that the level of precision for the map legends used in his study had to be adjusted so that “categories commonly reported at the ratio level (e.g., precision/resolution)…match[ed] uncertainty categories commonly reported at the ordinal level (e.g., credibility).” This suggests that each of the uncertainty types may commonly be associated with a specific level of measurement or precision; however, less common combinations of type and precision level (such as highly precise reports of consistency based on a survey describing expert agreement and its margin of error, or low-precision reports of accuracy as within or beyond tolerance) are certainly possible. Interestingly, Roth (2009a, 36) grounds his discussion of precision levels not in literature describing a hierarchy of precision in uncertainty representation (e.g., Kandlikar et al. 2005), but in work by Beard and Mackaness (1993) describing a three-level hierarchy of precision (and difficulty) in geographic uncertainty assessment tasks: 1) notification that the geographic data are uncertain; 2) identification of the type and relative amount of uncertainty; and 3) quantification of the exact amount of uncertainty. This task hierarchy calls attention to the importance of the map user in determining the precision with which cartographic features communicate uncertainty. Uncertainty may be presented with great precision, but if map users lack expertise for reading probability density functions or other similarly precise uncertainty presentations, then they will probably understand such presentations only at the notification or identification level—if they recognize them as indicators of uncertainty at all. More studies are needed to consider this relationship between user expertise and levels of precision in uncertainty, both as expressed in representations and as understood through tasks.
APPLICATION OF THREE PERSPECTIVES TO NOAA VIEWER
An examination of the NOAA Viewer’s communication of uncertainty from all three perspectives suggests that they are compatible, and may be applied simultaneously to better understand how sea level rise maps communicate uncertainty. For the three components of sea level rise information, the NOAA Viewer explicitly communicates the uncertainty about the attribute and spatial components cartographically: for uncertainty about how much sea levels will rise, an interactive slider allows the user to select different amounts of sea level rise and explore the extent of flooding they may cause using the dynamically updated inundation overlay; for uncertainty about the extent of inundation for a given scenario, a “confidence” overlay shows which areas have a high probability of flooding under the scenario, and which areas have a lower (but still significant) probability. Although temporal uncertainty is not explicitly represented on the NOAA map, its interactive slider for selecting sea level rise amounts may imply temporal uncertainty by presenting an ordered sequence of sea level rise scenarios that “suggests the passage of time” but does not assign specific dates (Kostelnick et al. 2013, 213).
The Viewer also communicates at least two different types of uncertainty information. As described in Roth et al. (in press), the Viewer shows completeness by applying a hatching texture to areas for which sea level rise was not mapped due to limitations in the NOAA model and data. Additionally, the confidence overlay may communicate trustworthiness, accuracy/error, or perhaps both. Roth et al. (in press) contends that this overlay uses different hues to identify areas where its depiction of sea level rise inundation is more or less trustworthy; however, supplementary documentation (NOAA 2010) states that this overlay is generated via a statistical calculation of the accuracy with which an area can be considered inundated, given the selected amount of sea level rise and the cumulative error from the DEM and tidal model.
The precision with which the Viewer represents these uncertainty types is generally low. Completeness of the sea level rise overlay is shown at the nominal level, with the hatching showing areas not mapped. Despite being generated via a precise statistical calculation, confidence is shown at the ordinal level, using “high” and “low” categories. Since this tool is available to the public and does not require any training, these design decisions may reflect a desire on the part of NOAA to notify users of uncertainty without overwhelming them with highly precise information that would support more advanced uncertainty quantification tasks (Beard and Mackaness 1993). As discussed in the next section, user expertise is one of many individual differences that mapmakers may want to consider when deciding how to depict sea level rise and its uncertainty.
EFFECTS OF UNCERTAINTY AND INDIVIDUAL DIFFERENCES ON RISK PERCEPTION AND RESPONSE FOR SEA LEVEL RISE
Because spatial reasoning about the sea level rise hazard—including decisions about the risks to one’s community, and whether landmarks within that community are worth protecting—often requires considering these uncertainties, it is important to understand how users of popular depictions of sea level rise (e.g., the NOAA Viewer) understand and act on them.
The available evidence suggests that including uncertainty information on sea level rise maps can be helpful to users. Several studies have suggested that including uncertainty on maps can improve decision outcomes (Deitrick and Edsall 2006; Brickner et al. 2007; review from Harrower 2003). In the climate change context, some authors have argued that including uncertainty in public communications may cut both ways, particularly when attempting to reach those who are doubtful or disengaged about climate change: while some map users may appreciate an honest depiction of uncertainty, this uncertainty may also lead others to underestimate risk or justify delaying adaptive action (Swim et al. 2009; Moser 2010). However, governments and public officials often need this uncertainty information to successfully assess climate change risks and prioritize the implementation of mitigation and adaptation to high-risk areas. Model means and consensus estimates may fail to capture outliers with important policy implications (Oppenheimer et al. 2007; Brown and Wilby 2012); for this reason, models that do not account for uncertainty have been found to significantly underestimate the protective response needed to cope with sea level rise (Lewandowsky et al. 2014). For a more general audience, including uncertainty information in climate change materials may promote public trust in climate science, since a range of possible futures may be seen as more credible than a single, worst case scenario (Sheppard 2005).
Authors have also considered both whether and how individual differences can affect map users’ understanding of uncertainty information, and ultimately their decision making process. From the limited literature addressing the mapping of uncertain hazards, authors have stressed the importance of designing for different user groups (Hagemeier-Klose and Wagner 2009), including those with different “culture or knowledge” (Fuchs et al. 2009) and those who perform different types of tasks, with varying levels of data complexity (Pang 2008). These considerations may be even more important when the map is interactive, since “interactive visualization has the potential to allow users to tailor displays to reflect their individual differences” (Bostrom et al. 2008, 34).
Beyond these general insights, several authors have also considered specific ways in which one particularly important type of individual difference—map users’ expertise—may affect their interpretation of uncertainty information about flood hazards. Roth (2009a) found that when shown a map with uncertain floodplain boundaries, map users with expertise—both in map use and especially in floodplain mapping—had higher risk assessments and assessment confidence than novices. He also noted a potentially dangerous combination of expertise: users who were map-use experts but flood-mapping novices had high confidence in their assessments, but significantly underestimated the risk relative to the domain experts, suggesting that they did not fully appreciate the potential for unfortunate surprises that the domain experts recognized in the uncertain data. In the sea level rise context, Kostelnick et al. (2013) describes a similar fear that novice users of sea level rise maps will not appreciate their significant spatial uncertainty, and will zoom in to levels not appropriate given the resolution of the data. Monmonier (2008) relates that, when faced with a similar concern regarding novice users’ ability to interpret sea level rise maps, the US Environmental Protection Agency opted to produce versions with different descriptions of uncertainty for research papers, the popular press, and the general public. Roth (2009a) suggests that while such user-aware design approaches are desirable, uncertainty should not be relegated to marginalia, but should be represented explicitly on the map, where it will be difficult for novices to ignore. Deitrick and Edsall (2009) argue that such an approach is particularly important in the context of climate change media, where seemingly authoritative graphics in news reports communicate possible futures but generally not their own uncertainty.
This literature suggests two lessons: 1) including uncertainty information on sea level rise maps may promote more informed risk assessment and decision making; and 2) individual differences (particularly user expertise) will likely affect both how map users interpret these sea level rise uncertainties and how they act on them. However, mapmakers who heed these lessons will likely face additional, largely unanswered questions: which other individual differences are likely to have significant effects on the interpretation of uncertainties, and what will these effects be? The next three sections explore these questions, examining three examples of cases where individual differences may shape how map users understand and act on uncertainty in general, and sea level rise uncertainty in particular. These sections consider situations where aspects of each of the three perspectives on uncertainty described above have been suggested to dictate (or at least strongly influence) adaptive or mitigative action in the context of sea level rise or similarly uncertain hazards. They sketch out the reasons why these expected relationships are at least somewhat justified, and then problematize these accounts by showing how context and individual differences mediate (and in some cases reverse) these expected relationships. A concluding section discusses how these effects of individual differences on the interpretation of uncertainty may inform the design of sea level rise maps.
CERTAINTY IN THE SPATIAL, TEMPORAL, AND ATTRIBUTE COMPONENTS OF DAMAGING SEA LEVEL RISE ENCOURAGES MORE ADAPTIVE AND MITIGATIVE ACTION
Several authors have suggested that when people perceive a threat as more likely—e.g., when spatial and temporal certainty of a damaging amount of sea level rise is seen as high—they are more likely to take action to respond to the threat. Thus, in the model of climate change adaptation proposed by Grothmann and Patt (2005), risk appraisal (a combination of perceived probability and severity) is an important driver of adaptation intentions. Working with a similar model, Grothmann and Reusswig (2006) confirmed that risk appraisal was a significant predictor of protective responses for flooding. Moreover, while not studying the effect on protective responses, Severtson and Myers (2012) found that study participants assigned to higher risk zones on a map of cancer risk generally had stronger risk beliefs.
For sea level rise, this suggests that people in areas where inundation is more likely should also be more likely to take adaptive or mitigative action. But this willingness to take action will likely also depend on the characteristics of the hazard and individual differences. If the sea level rise threat is seen as so great that it overwhelms an individual’s perceived adaptive capacity, then being located in a high-risk zone might lead to a fatalistic response. For example, Howe (2011) proposes that fatalism may explain why businesses at the highest risk of storm surge flooding took the fewest adaptive actions. Grothmann and Patt’s (2005) model acknowledges that such maladaptive responses (also including denial and wishful thinking) will often dampen the response to climate threats.
Beyond such “maladaptive” responses, people may also differ on what they feel is an acceptable risk (Nicholson et al. 2005). Thus, there is unlikely to be an objective way to determine a single probability value for sea level rise above which it would be logical to take personal action (such as moving away from the risky location). Some people may value the immediate amenities of living near the ocean highly enough to bear an almost certain risk of inundation in 2050 or 2100, especially since they are likely to significantly discount the inundation risk at these times several decades in the future. This is supported by a series of studies of home values and risk perception in the Houston area, which found that proximity to the ocean was seen as both an amenity and a hazard, with conflicting effects on home value (Zhang et al. 2010; Lindell and Hwang 2008).
SOME TYPES OF UNCERTAINTY ARE GIVEN GREATER WEIGHT THAN OTHERS IN DECISION MAKING
The type of uncertainty presented to map users may also affect their decision making. For example, uncertainty may be used quite differently in decision making when it is communicated as consistency in opinion among a panel of experts rather than as a model-based expression of accuracy or precision. For example, Patt (2007) found that students’ subjective estimates for the likelihood of a certain amount of sea level rise were closer to 50/50 if the probability of the sea level rise was presented as a level of agreement among experts, rather than as a model-based probability estimate. This suggests a significant effect of the type of uncertainty (and possibly the message source) on how uncertainty information is weighted in the decision process.
However, it cannot be assumed that everyone will ascribe the same uncertainty types to information about sea level rise. In an example from Patt (2007), a person who does not trust climate modelers may believe that a modeled probability of sea level rise is also highly subjective and discount it accordingly. This is in line with Wachinger et al.’s (2010) finding that trust in experts and authorities was one of the most frequently cited factors associated with higher risk perceptions and more protective actions for natural hazards. While there is probably no objectively correct way to weight disagreement among expert predictions, engaging with residents and stakeholders through participatory exercises may build trust (Wachinger et al. 2010). This could help to fight the perception among the disengaged and dismissive that scientists remain divided on whether climate change is happening and will have harmful effects.
Additional research is needed to explore the comparative weight given to uncertainty types other than consistency/subjectivity and accuracy/precision in the sea level risk assessment context. The results of such studies could help mapmakers’ choose uncertainty types that users are less likely to interpret in ways that run counter to the accepted science.
WHEN UNCERTAINTIES ARE EXPRESSED IMPRECISELY, RISK PERCEPTIONS ARE HIGHER
Economists and decision theorists have found that, when people are presented with a low to moderate—but imprecise—probability of a hazardous event (such as sea level rise flooding), they are likely to skew their perception of the risk towards the worst possible outcome (e.g., the highest probability of flooding possible given the imprecise specification) (Einhorn and Hogarth 1985; Kuhn 2000; Rustichini 2005). This finding is based on researchers’ observation that people generally prefer to bet on outcomes with known, precisely specified probabilities rather than outcomes with vague or imprecisely defined probabilities (Ellsberg 1961), and will pay a premium to avoid or remove such vagueness or imprecision (Becker and Brownson 1964). Although generally referred to as “ambiguity aversion” in the economic and decision science literature (Ellsberg 1961; Becker and Brownson 1964), this tendency may be more properly termed “vagueness aversion,” since imprecisely specified probabilities suggest a range of possible values, rather than the small set of distinct possibilities implied by ambiguity (Kuhn 1997).
This finding of greater risk perception under vagueness would seem to be readily applicable to sea level rise and climate change, where epistemic (limited knowledge about climate processes), natural stochastic (irreducible complexity of the climate response), and human reflexive (unknowns in the future socioeconomic system) elements all limit our ability to provide well defined probability estimates for specific climate outcomes (Dessai and Hulme 2004). Given the large uncertainties and the potential for highly disruptive impacts, the application of the first element of the precautionary principle—“taking preventive action in the face of uncertainty” (Kriebel et al. 2001, 871)—to climate change would appear to be an example of a response to uncertainty that would be in line with the expected increase in risk perception under vagueness. In line with this expectation, several authors have suggested that more should be done to communicate high-impact sea level rise scenarios (Oppenheimer et al. 2007; Nicholls and Cazenave 2010; Brysse et al. 2013), the apparent expectation being that the possibility (with small but unknown probability) of such a highly disruptive future should lead to adaptive or mitigative action.
However, as argued in Kuhn (2000), vagueness may not always increase risk perception, particularly for environmental problems and related hazards, where motivated reasoning may interact with vagueness to increase or decrease perceived risk. Kuhn (2000) found that prior environmental attitudes determined whether risk perceptions skewed towards the top or bottom of a range of probabilities given for an environmental hazard; this effect increased when the high and low ends of the range were associated with sources with a known bias. In a cartographic context, Severtson and Myers (2012) similarly found that when assessing risk in a high risk zone on a map, participants in a study were more likely to have lower risk beliefs if the boundaries of this high-risk zone were blurred in a way suggesting vagueness. Thus, rather than an unambiguously positive relationship between vagueness and risk perception that might suggest a clear role for the precautionary principle in the response to climate change, uncertainties in climate change impacts may also lead some people to lower their risk perceptions.
Individual differences in comfort and perceived competence with climate data may also affect vagueness aversion. While early attempts to model vagueness aversion focused on the effect of imprecise probabilities on decision-making (e.g., Einhorn and Hogarth 1985), later work suggested that the preference for precisely defined probabilities in such situations may be an example of a broader inclination towards choices that are well known (and about which one has some level of expertise, or a general “feeling of competence”) over choices which are poorly understood (Heath and Tversky 1991). As a product of both imprecision in the underlying data and individuals’ recognition and interpretation of this imprecision, vagueness aversion will thus be felt most strongly when these two factors (data and expertise) combine in ways that lead to a perceived lack of competence. Hope and Hunter (2007) have explored this interaction between expertise and vagueness aversion in a cartographic context; future work could consider this interaction as it applies specifically to sea level rise mapping.
CONCLUSIONS: LESSONS FOR MAPPING SEA LEVEL RISE AND OTHER UNCERTAIN CLIMATE FUTURES
What lessons does this literature hold for the communication of uncertainty on online, interactive sea level rise maps like the NOAA Viewer and Climate Central’s Surging Seas? Perhaps most importantly, sea level rise map design demands a user-centered perspective. As a popular and powerful medium for communicating one of the more dramatic impacts of climate change on coastal communities, these maps appeal to many audiences, ranging from scientists and policymakers to members of the general public (Monmonier 2008; Kostelnick et al. 2013). Because sea level rise is a highly uncertain hazard, communicating this uncertainty to all of these diverse map users is likely necessary and important: for scientists and policymakers, it may improve decision outcomes (Deitrick and Edsall 2006; Brickner et al. 2007; review from Harrower 2003), and for members of the public more interested in general exploration of the sea level rise hazard, it may dissuade anchoring on a single scenario (Deitrick and Edsall 2009) and establish credibility by clearly indicating limitations in the data and models (Sheppard 2005; Spiegelhalter et al. 2011). Despite these general benefits of showing uncertainty on sea level rise maps, each of the many audiences these maps serve is likely to interpret these uncertainties somewhat differently (as shown for other hazard maps in Roth [2009a] and Severtson and Myers [2012]), suggesting the need for designs that are customized (or interactive and customizable) to address these differences. This may be particularly true in cases where individual differences can lead users to interpret uncertainties in ways that significantly underestimate risks (relative to expert assessments) or encourage maladaptive responses (see, e.g., Roth 2009a).
The examples reviewed in this article suggest at least two types of individual differences that may contribute to such dangerous distortions in map users’ risk perception and response: user expertise and trust. Compared to domain and map-use experts, novices have been shown to have lower risk perceptions after studying a map of an uncertain flood plain (Roth 2009a); novices may similarly discount the possibility of high-end impacts on maps of sea level rise uncertainty. This is supported by work in the vagueness aversion literature, which has found that expertise can shape interpretation of imprecisely defined probabilities for hazardous events (Heath and Tversky 1991). Roth (2009a) suggests that despite novices’ underestimation of flood risk, they may still take appropriate precautions because they also have lower confidence in their risk assessments, and may therefore be more likely to consult an expert. However, if the novice map users do not trust the relevant experts, then they may not seek or value their opinion. This may be particularly true for politically charged climate hazards such as sea level rise, where considerations such as the message source and type of uncertainty (Patt 2007) and users’ prior environmental beliefs (Kuhn 2000) may affect their trust in the uncertainty shown on hazard maps (and experts’ assessments of it). Prior beliefs about the environment in general and climate change in particular are therefore another individual difference that may shape sea level rise risk perceptions; others introduced in this article include hazard proximity and perceived adaptive capacity. More studies are needed to explore these in the cartographic context, and to identify additional individual differences that may also affect map users’ interpretation of uncertainties on hazard maps.
In addition to identifying which individual differences are most likely to affect the interpretation of uncertainty, mapmakers must also decide whether and how to design for these differences. At the most basic level, this may include decisions about which components of geographical uncertainty should be shown, using which types of uncertainty, and at what level of precision; it may also include considerations of which representational techniques (e.g., visual variables and map interaction) should be used to communicate these uncertainties. The following list presents some general guidance on how mapmakers might approach these decisions in light of the literature considered in this article.
- Brysse et al. (2013, 327) argue that the scientific commitment to restraint, objectivity, skepticism, rationality, dispassion, and moderation has actually led climate scientists to generally err “on the side of least drama.” Map makers should not shy away from dramatic presentations: visualizations showing projected impacts of sea level rise on local landscapes can drive home the personal relevance of rising seas (Nicholson-Cole 2005; Sheppard 2005), and when made engaging and interactive they may also encourage deeper understanding of complex scientific information (Rapp 2005). However, because such visualizations can be so convincing, they must be used with great care, and employ what Sheppard (2005) calls “permissible drama”—the idea that the map or visualization should remain grounded in a scientifically plausible (e.g., not exaggerated) future, and that goals of the visualization should be made explicit (e.g., raising awareness about the possible future impacts of sea level rise).
- Multiple authors (Deitrick and Edsall 2009; Roth 2009a; Spiegelhalter et al. 2011) have stressed that maps and other depictions of uncertain hazards such as sea level rise should clearly and prominently communicate their limitations. For interactive, online sea level rise maps, this suggests that mapmakers should strongly consider explicitly communicating uncertainties associated with all three components of sea level rise information: space, time, and attribute. While spatial and attribute uncertainty are already represented on some of these maps (including the NOAA Viewer and Climate Central’s Surging Seas), mapmakers should consider representing temporal uncertainty more explicitly (rather than implying it using sliders and animation).
- Following the lead of MacEachren et al. (2012), mapmakers and researchers could explore the use of visual metaphors to represent possible combinations of uncertainty components and types on sea level rise maps. To extend this work, researchers could consider how adjusting the visual variables used to construct these metaphors might communicate uncertainty with different levels of precision.
- As discussed in Kostelnick et al. (2013), mapmakers should consider communicating uncertainty using map interaction as well as visual variables. This is an active area of research. For example, recent work by Roth (2012; 2013) explores a possible typology for map interaction primitives, and speculates about the use of map interaction to communicate uncertainty.
- The potential parallel between levels of precision in the expression of uncertainty (as described in the IPCC uncertainty guidance, Mastrandrea et al. 2010) and the hierarchy of precision (and difficulty) for uncertainty assessment (Beard and Mackaness 1993) may warrant further exploration. If user expertise can be matched with an appropriate level of assessment task, then perhaps this task level can be further paired with a corresponding level of precision in the cartographic presentation of uncertainty. This could perhaps lead to a better fit between map design and user expertise. However, as discussed in the above section on vagueness aversion, other individual differences (such as prior environmental beliefs) can also affect users’ interpretation of imprecisely defined uncertainties, potentially complicating mapmakers’ decisions about which level of precision is most appropriate.
- Mapmakers may also consider adjusting the production and presentation of their maps to help earn the trust of their audiences. Seeking these audiences’ active participation in the design of sea level rise maps may help build trust in their depictions of sea level rise and its uncertainty (Patt 2007). Mapmakers should also consider which types of uncertainty might be considered most or least trustworthy for the map’s intended audience, perhaps based in part on its predominant political or environmental beliefs.
Much of this guidance is preliminary. In particular, additional studies are needed to assess: which visual variables and forms of map interaction most effectively communicate different combinations of uncertainty types and precision in the sea level rise context; which individual differences most strongly affect interpretation of these uncertainties; and how the types, precision, and presentation of uncertainty might be adjusted to limit the effect of any individual differences that may strongly bias its interpretation. Nonetheless, it is hoped that by raising these questions and beginning to explore possible answers, this article will prove valuable both to researchers in the field of cartographic uncertainty representation and to designers of maps of sea level rise and other similarly uncertain environmental hazards.
ACKNOWLEDGEMENTS
Thank you to the attendees and organizers of the Association of American Geographers 2014 sessions on Cognition, Behavior, and Representation for their insightful questions and comments on this research, and to the reviewers for their helpful feedback and suggestions. Thank you as well to Jennifer Mason for many fruitful discussions of uncertainty representation and decision making, and to my doctoral committee (Dr. Brent Yarnal, Dr. Alex Klippel, Dr. Cynthia Brewer, and Dr. Janet Swim) for their continued guidance and support.
REFERENCES
Bankes, S. C. 2002. “Tools and Techniques for Developing Policies for Complex and Uncertain Systems.” Proceedings of the National Academy of Sciences 99 (supplement 3): 7263–7266. doi:10.1073/pnas.092081399.
Beard, K., and W. Mackaness. 1993. “Visual Access to Data Quality in Geographic Information Systems.” Cartographica 30 (2): 37–45. doi:10.3138/C205-5885-23M7-0664.
Becker, S. W., and F. O. Brownson. 1964. “What Price Ambiguity? or the Role of Ambiguity in Decision-Making.” Journal of Political Economy 72 (1): 62–73. doi:10.1086/258854.
Bostrom, A., L. Anselin, and J. Farris. 2008. “Visualizing Seismic Risk and Uncertainty.” Annals of the New York Academy of Sciences 1128 (1): 29–40. doi:10.1196/annals.1399.005.
Brickner, M. S., D. Sheffer, Y. Alef, I. Brickner, and A. Sirkis. 2007. Better Decision Making through Representation and Reduction of Uncertainty in C3I Information System. DTIC Document. Accessed October 16, 2012. http://oai.dtic.mil/oai/oai?verb=getRecord&metadataPrefix=html&identifier=ADA478785.
Brown, C., and R. L. Wilby. 2012. “An Alternate Approach to Assessing Climate Risks.” EOS, Transactions of the American Geophysical Union 93 (41): 401–412. doi:10.1029/2012EO410001.
Brysse, K., N. Oreskes, J. O’Reilly, and M. Oppenheimer. 2013. “Climate Change Prediction: Erring on the Side of Least Drama?” Global Environmental Change 23 (1): 327–337. doi:10.1016/j.gloenvcha.2012.10.008.
Deitrick, S., and R. Edsall. 2006. “The Influence of Uncertainty Visualization on Decision Making: An Empirical Evaluation.” In Progress in Spatial Data Handling, edited by A. Riedl, W. Kainz, and G. E. Elmes, 719–738. Berlin: Springer.
———. 2009. “Mediated Knowledge and Uncertain Science: Maps in Communicating Climate Change in Mass Media.” Proceedings of the 14th International Cartographic Conference, Santiago, Chile. Accessed August 19, 2014. http://ns1.icaci.org/files/documents/ICC_proceedings/ICC2009/html/refer/27_1.pdf.
Dessai, S., and M. Hulme. 2004. “Does Climate Adaptation Policy Need Probabilities?” Climate Policy 4 (2): 107–128. doi:10.1080/14693062.2004.9685515.
Einhorn, H. J., and R. M. Hogarth. 1985. “Ambiguity and Uncertainty in Probabilistic Inference.” Psychological Review 92 (4): 433–461. doi:10.1037/0033-295X.92.4.433.
Ellsberg, D. 1961. “Risk, Ambiguity, and the Savage Axioms.” The Quarterly Journal of Economics 75 (4): 643–669. doi:10.2307/1884324.
Fuchs, S., K. Spachinger, W. Dorner, J. Rochman, and K. Serrhini. 2009. “Evaluating Cartographic Design in Flood Risk Mapping.” Environmental Hazards 8 (1): 52–70. doi:10.3763/ehaz.2009.0007.
Grothmann, T., and A. Patt. 2005. “Adaptive Capacity and Human Cognition: The Process of Individual Adaptation to Climate Change.” Global Environmental Change 15 (3): 199–213. doi:10.1016/j.gloenvcha.2005.01.002.
Grothmann, T., and F. Reusswig. 2006. “People at Risk of Flooding: Why Some Residents Take Precautionary Action While Others Do Not.” Natural Hazards 38 (1–2): 101–120. doi:10.1007/s11069-005-8604-6.
Hagemeier-Klose, M., and K. Wagner. 2009. “Evaluation of Flood Hazard Maps in Print and Web Mapping Services as Information Tools in Flood Risk Communication.” Natural Hazards and Earth System Sciences 9 (2): 563–574. doi:10.5194/nhess-9-563-2009.
Harrower, M. 2003. Representing Uncertainty: Does it Help People Make Better Decisions? Ithaca, NY: University Consortium for Geographic Information Science. Accessed October 16, 2012. http://citeseerx.ist.psu.edu/viewdoc/download?doi=10.1.1.59.2463&rep=rep1&type=pdf.
Hawkins, E., and R. Sutton. 2009. “The Potential to Narrow Uncertainty in Regional Climate Predictions.” Bulletin of the American Meteorological Society 90 (8): 1095–1107. doi:10.1175/2009BAMS2607.1.
Heath, C., and A. Tversky. 1991. “Preference and Belief: Ambiguity and Competence in Choice Under Uncertainty.” Journal of Risk and Uncertainty 4 (1): 5–28. doi:10.1007/BF00057884.
Hope, S., and G. J. Hunter. 2007. “Testing the Effects of Thematic Uncertainty on Spatial Decision-making.” Cartography and Geographic Information Science 34 (3): 199–214. doi:10.1559/152304007781697884.
Howe, P. D. 2011. “Hurricane Preparedness as Anticipatory Adaptation: A Case Study of Community Businesses.” Global Environmental Change 21 (2): 711–720. doi:10.1016/j.gloenvcha.2011.02.001.
IPCC. 2013. Climate Change 2013: The Physical Science Basis. Contribution of Working Group I to the Fifth Assessment Report of the Intergovernmental Panel on Climate Change. Edited by T. F. Stocker, D. Quin, G.-K. Plattner, M. Tignor, S. K. Allen, J. Boshung, A. Nauels, Y. Xia, V. Bex, and P. M. Midgley. Cambridge, UK: Cambridge University Press.
Joughin, I., B. E. Smith, and B. Medley. 2014. “Marine Ice Sheet Collapse Potentially Under Way for the Thwaites Glacier Basin, West Antarctica.” Science 344 (6185): 735–738. doi:10.1126/science.1249055.
Kahan, D. M. 2013. “Making Climate-science Communication Evidence-based—All the Way Down.” In Culture, Politics and Climate Change, edited by D. Crow and M. T. Boykoff. London: Routledge. Accessed May 30, 2014. http://papers.ssrn.com/sol3/papers.cfm?abstract_id=2216469.
Kahan, D. M., M. Wittlin, E. Peters, P. Slovic, L. L. Ouellette, D. Braman, and G. N. Mandel. 2011. The Tragedy of the Risk-Perception Commons: Culture Conflict, Rationality Conflict, and Climate Change. Temple University Legal Studies Research Paper No. 2011-26, Cultural Cognition Project Working Paper No. 89, Yale Law & Economics Research Paper No. 435, Yale Law School, Public Law Working Paper No. 230. doi:10.2139/ssrn.1871503.
Kandlikar, M., J. Risbey, and S. Dessai. 2005. “Representing and Communicating Deep Uncertainty in Climate-change Assessments.” Comptes Rendus Geoscience 337 (4): 443–455. doi:10.1016/j.crte.2004.10.010.
Knight, F. H. 1921. Risk, Uncertainty and Profit. New York: Hart, Schaffner and Marx.
Kostelnick, J. C., D. McDermott, R. J. Rowley, and N. Bunnyfield. 2013. “A Cartographic Framework for Visualizing Risk.” Cartographica 48 (3): 200–224. doi:10.3138/carto.48.3.1531.
Kriebel, D., J. Tickner, P. Epstein, J. Lemons, R. Levins, E. L. Loechler, M. Quinn, R. Rudel, T. Schettler, and M. Stoto. 2001. “The Precautionary Principle in Environmental Science.” Environmental Health Perspectives 109 (9): 871–876. doi:10.1289/ehp.01109871.
Kuhn, K. M. 1997. “Communicating Uncertainty: Framing Effects on Responses to Vague Probabilities.” Organizational Behavior and Human Decision Processes 71 (1): 55–83. doi:10.1006/obhd.1997.2715.
———. 2000. “Message Format and Audience Values: Interactive Effects of Uncertainty Information and Environmental Attitudes on Perceived Risk.” Journal of Environmental Psychology 20 (1): 41–51. doi:10.1006/jevp.1999.0145.
Lang, C. 2014. “Do Weather Fluctuations Cause People to Seek Information about Climate Change?” Climatic Change 125 (3–4): 291–303. doi:10.1007/s10584-014-1180-6.
Leiserowitz, A. 2007. “Communicating the Risks of Global Warming: American Risk Perceptions, Affective Images, and Interpretive Communities.” In Creating a Climate for Change: Communicating Climate Change and Facilitating Social Change, edited by S. C. Moser and L. Dilling, 44–63. Cambridge: Cambridge University Press. doi:10.1017/CBO9780511535871.005.
Lewandowsky, S., J. S. Risbey, M. Smithson, B. R. Newell, and J. Hunter. 2014. “Scientific Uncertainty and Climate Change: Part I. Uncertainty and Unabated Emissions.” Climatic Change 124 (1–2): 21–37. doi:10.1007/s10584-014-1082-7.
Lindell, M. K., and S. N. Hwang. 2008. “Households’ Perceived Personal Risk and Responses in a Multihazard Environment.” Risk Analysis 28 (2): 539–556. doi:10.1111/j.1539-6924.2008.01032.x.
Lorenzoni, I., S. Nicholson-Cole, and L. Whitmarsh. 2007. “Barriers Perceived to Engaging with Climate Change Among the UK Public and their Policy Implications.” Global Environmental Change 17 (3–4): 445–459. doi:10.1016/j.gloenvcha.2007.01.004.
MacEachren, A. M. 1992. “Visualizing Uncertain Information.” Cartographic Perspectives 13: 10–19. doi:10.14714/CP13.1000.
MacEachren, A. M., A. Robinson, S. Hopper, S. Gardner, R. Murray, M. Gahegan, and E. Hetzler. 2005. “Visualizing Geospatial Information Uncertainty: What we Know and What we Need to Know.” Cartography and Geographic Information Science 32 (3): 139–160. doi:10.1559/1523040054738936.
MacEachren, A., R. E. Roth, J. O’Brien, B. Li, D. Swingley, and M. Gahegan. 2012. “Visual Semiotics & Uncertainty Visualization: An Empirical Study.” IEEE Transactions on Visualization and Computer Graphics 18 (12): 2496–2505. doi:10.1109/TVCG.2012.279.
Maibach, E., C. Roser-Renouf, and A. Leiserowitz. 2009. Global Warming’s Six Americas 2009: An Audience Segmentation Analysis. New Haven, CT: Yale Project on Climate Change/Fairfax, VA: Center for Climate Change Communication, George Mason University.
Mastrandrea, M. D., C. B. Field, T. F. Stocker, O. Edenhofer, K. L. Ebi, D. J. Frame, H. Held, E. Kriegler, K. J. Mach, and P. R. Matschoss. 2010. “Guidance Note for Lead Authors of the IPCC Fifth Assessment Report on Consistent Treatment of Uncertainties.” Intergovernmental Panel on Climate Change (IPCC). Accessed March 14, 2013. http://193.194.138.236/pdf/supporting-material/uncertainty-guidance-note.pdf.
Monmonier, M. 2008. “Web Cartography and the Dissemination of Cartographic Information about Coastal Inundation and Sea Level Rise.” In International Perspectives on Maps and the Internet, Lecture Notes in Geoinformation and Cartography, edited by P. M. P. Peterson, 49–71. Berlin/Heidelberg: Springer Berlin Heidelberg.
Moser, S. C. 2010. “Communicating Climate change: History, Challenges, Process and Future Directions.” Wiley Interdisciplinary Reviews: Climate Change 1 (1): 31–53.
———. 2005. “Impact Assessments and Policy Responses to Sea-level Rise in Three US States: An Exploration of Human-dimension Uncertainties.” Global Environmental Change 15 (4): 353–369. doi:10.1016/j.gloenvcha.2005.08.002.
Nicholls, R. J., and A. Cazenave. 2010. “Sea-Level Rise and Its Impact on Coastal Zones.” Science 328 (5985): 1517–1520. doi:10.1126/science.1185782.
Nicholson, N., E. Soane, M. Fenton-O’Creevy, and P. Willman. 2005. “Personality and Domain-specific Risk Taking.” Journal of Risk Research 8 (2): 157–176. doi:10.1080/1366987032000123856.
Nicholson-Cole, S. A. 2005. “Representing Climate Change Futures: a Critique on the use of Images for Visual Communication.” Computers, Environment and Urban Systems 29 (3): 255–273. doi:10.1016/j.compenvurbsys.2004.05.002.
NOAA Coastal Services Center. 2010. Mapping Inundation Uncertainty. Accessed October 22, 2014. http://coast.noaa.gov/digitalcoast/_/pdf/ElevationMappingConfidence.pdf.
Oppenheimer, M., B. C. O’Neill, M. Webster, and S. Agrawala. 2007. “The Limits of Consensus.” Science 317 (5844): 1505–1506. doi:10.1126/science.1144831.
Pang, A. 2008. “Visualizing Uncertainty in Natural Hazards.” In Risk Assessment, Modeling and Decision Support, edited by A. Bostrom, S. French, and S. Gottlieb, 261–294. Berlin/Heidelberg: Springer Berlin Heidelberg.
Patt, A. 2007. “Assessing Model-based and Conflict-based Uncertainty.” Global Environmental Change 17 (1): 37–46. doi:10.1016/j.gloenvcha.2006.10.002.
Preston, B. L., E. J. Yuen, and R. M. Westaway. 2011. “Putting Vulnerability to Climate Change on the Map: a Review of Approaches, Benefits, and Risks.” Sustainability Science 6 (2): 177–202. doi:10.1007/s11625-011-0129-1.
Rapp, D. 2005. “Mental Models: Theoretical Issues for Visualizations in Science Education.” In Visualization in Science Education, Models and Modeling in Science Education, edited by J. Gilbert, 43–60. Netherlands: Springer Netherlands.
Retchless, D. P. 2014. “Communicating Climate Change: Spatial Analog Versus Color-banded Isoline Maps with and without Accompanying Text.” Cartography and Geographic Information Science 41 (1): 55–74. doi:10.1080/15230406.2013.826479.
Roth, R. E. 2009a. “The Impact of User Expertise on Geographic Risk Assessment Under Uncertain Conditions.” Cartography and Geographic Information Science 36 (1): 29–43. doi:10.1559/152304009787340160.
———. 2009b. “A Qualitative Approach to Understanding the Role of Geographic Information Uncertainty During Decision Making.” Cartography and Geographic Information Science 36 (4): 315–330. doi:10.1559/152304009789786326.
———. 2012. “An Empirically Derived Taxonomy of Cartographic Interaction Primitives.” Proceedings of GIScience 2012, Columbus, OH, September 18–21.
———. 2013. “Interactive maps: What we know and what we need to know.” Journal of Spatial Information Science 6: 59–115.
Roth, R. E, C. Quinn, and D. Hart. In press. The Competitive Analysis Method for Evaluating Water Level Visualization. Lecture Notes in Geoinformation and Cartography.
Rustichini, A. 2005. “Emotion and Reason in Making Decisions.” Science 310 (5754): 1624–1625. doi:10.1126/science.1122179.
Schnotz, W. 2002. Commentary: “Towards an Integrated View of Learning from Text and Visual Displays.” Educational Psychology Review 14 (1): 101–120. doi:10.1023/A:1013136727916.
Severtson, D. J., and J. D. Myers. 2012. “The Influence of Uncertain Map Features on Risk Beliefs and Perceived Ambiguity for Maps of Modeled Cancer Risk from Air Pollution.” Risk Analysis 33 (5): 818-837. doi:10.1111/j.1539-6924.2012.01893.x.
Sheppard, S. R. . 2005. “Landscape Visualisation and Climate Change: the Potential for Influencing Perceptions and Behaviour.” Environmental Science and Policy 8 (6): 637–654. doi:10.1016/j.envsci.2005.08.002.
Spiegelhalter, D., M. Pearson, and I. Short. 2011. “Visualizing Uncertainty About the Future.” Science 333 (6048): 1393 –1400. doi:10.1126/science.1191181.
Swim, J., S. Clayton, T. Doherty, R. Gifford, G. Howard, J. Reser, P. Stern, and E. Weber. 2009. Psychology and Global Climate Change: Addressing a Multi-faceted Phenomenon and Set of Challenges. American Psychological Association. Accessed May 30, 2014. http://www.apa.org/science/about/publications/climate-change.pdf.
Wachinger, G., O. Renn, C. Bianchizza, T. Coates, B. De Marchi, L. Domènech, I. Jakobson, C. Kuhlicke, L. Lemkow, and L. Pellizzoni. 2010. Risk Perception and Natural Hazards. CapHaz-Net WP3Report. Stuttgart: DIALOGIK Non-Profit Institute for Communication and Cooperative Research. Accessed March 29, 2013. http://caphaz-net.org/outcomes-results/CapHaz-Net_WP3_Risk-Perception2.pdf.
Willows, R., N. Reynard, I. Meadowcroft, and R. Connell. 2003. Climate Adaptation: Risk, Uncertainty and Decision-making. UKCIP Technical Report. Oxford: Climate Impacts Programme. Accessed August 22, 2014. http://nora.nerc.ac.uk/2969/1/N002969CR.pdf.
Zhang, Y., S. N. Hwang, and M. K. Lindell. 2010. “Hazard Proximity or Risk Perception? Evaluating Effects of Natural and Technological Hazards on Housing Values.” Environment and Behavior 42 (5): 597–624. doi:10.1177/0013916509334564.