DOI: 10.14714/CP86.1392
Designing a Rule-based Wizard for Visualizing Statistical Data on Thematic Maps
Angeliki Tsorlini, ETH Zürich | atsorlini@gmail.com
René Sieber, ETH Zürich | rene.sieber@karto.baug.ethz.ch
Lorenz Hurni, ETH Zürich | lhurni@ethz.ch
Hubert Klauser, OCAD, Inc. | klh@ocad.com
Thomas Gloor, OCAD, Inc. | thg@ocad.com
Thematic maps are used in a wide range of scientific fields to illustrate specific geographic phenomena. For their correct construction, the mapmaker has to select the appropriate data, and then consider different parameters and constraints in order to visualize them effectively. In this paper, these parameters were analyzed, so that a consistent and standardized workflow for producing thematic maps could be set up. This workflow served as the basis for designing and implementing a step-by-step wizard-based application. Its goal is to guide mapmakers—experts or laypersons—to create cartographically sound thematic maps based on statistical data, in a user-friendly way. To standardize the procedure, we analyzed the relationships between different mapping techniques and the types of data with which they are used to illustrate a geographic phenomenon. Based on this analysis, we created a new taxonomy of mapping techniques and used it to automate the selection procedure within the wizard. This analysis could also be of general use for researchers producing thematic maps in different mapping applications.
KEYWORDS: thematic cartography; thematic mapping techniques; cartographic design principles; wizard-based application
INTRODUCTION
Thematic maps graphically represent a number of attributes or concepts in order to show the spatial distribution of a particular geographic phenomenon over an area (Spiess 1970a; 1970b; Dent 1996). To select the proper mapping technique to correctly visualize a geographic phenomenon, the mapmaker has to make several consecutive decisions based upon the data to be used. Thematic mapping techniques and map representations used for one type of data may be inappropriate for another type, potentially depicting the phenomenon in a misleading way (Hutzler and Spiess 1993).
A number of software applications that offer various techniques for producing thematic maps are available today. However, these applications do not usually inform mapmakers about the specific properties of each mapping technique or the data that they are suitable for representing. For this reason, there is value in developing an application to guide the mapmaker through the design of a proper thematic map, from the selection of the data, to the selection of an appropriate mapping technique, to the final construction of the map. To design such an application, it is important to first analyze the steps of the cartographic procedure usually followed in producing thematic maps. Additionally, it is necessary to study commonly applied cartographic principles and rules concerning the relationship between mapping techniques and the type of the data (interval/ratio data with absolute/relative values) they are based on.
In this paper, we present the results of this analysis, along with the schemes we created to show how the cartographic principles are interconnected, which together lead to a workflow that standardizes the whole procedure and systematizes the selection of appropriate mapping techniques. Based on this analysis and the detailed schemes, we design and implement an application to guide the user through a step-by-step wizard to create correct thematic maps following principles and rules commonly applied in thematic cartography. Using this wizard, the complexity of the visualization task in producing a thematic map is significantly simplified.
STATE-OF-THE-ART: SOFTWARE TO CREATE THEMATIC MAPS WITH STATISTICAL DATA
A number of software applications provide for the visualization of a theme on a map. Maps with proportional or graduated symbols, maps with charts, dot density maps, or choropleth maps may be designed using GIS software such as ArcGIS by Esri or QGIS. There is also dedicated cartographic software, such as Maptitude Mapping Software by Caliper, Regiograph by GfK GeoMarketing GmbH, and Cartovista by DBx Geomatics (a list of links to all software applications mentioned in this section is found at the end of this paper). Additionally, several online applications allow users to create thematic maps by uploading their own data or using the data already included in these platforms; examples include CARTO, Thematic Mapping API, Statplanet by StatSilk, and Indiemapper by Axis Maps.
Plug-ins and extensions allow several other programs to offer thematic map functionality. Thematic maps (including maps with charts, proportional or graduated symbol maps, dot density maps, and choropleth maps) may be created in Adobe Illustrator by using the plug-ins implemented at the Institute of Cartography and Geoinformation, ETH Zurich (Werner and Hutzler 2006; Hurni and Hutzler 2008). Microsoft Excel features the Excelcharts plug-in, which uses scripts and macros to produce thematic maps. Additionally, Excel’s Power Map add-in lets users plot geographic and temporal data on a 3D globe or on a custom map, animate it over time, and also create visual tours. Finally, the Diagram map creator plug-in, implemented by Valent (2010) as an ArcGIS extension, allows users to produce various types of diagram maps in ArcGIS, under the condition that the statistical data are already included in the attribute table of the shapefile.
For the production of thematic maps, all these applications use statistical data in table form connected to the spatial geometry data that is used to cartographically depict the statistical data. For every shape in the geometry data, a specific record exists containing descriptive information—e.g., ID, name, or size properties—in an accompanying attribute table. In most applications, the procedure is similar: the statistical table is joined to the geometry’s attribute table using common identifying values (ID), and the theme is visualized within the frame of the geometry by applying the appropriate mapping technique. In order to create a map using one of these applications, the mapmaker may apply any technique whether or not it is suitable for the selected statistical data. However, none of the applications provides an automatic procedure for the context-related selection of an appropriate visualization. Even in software with some automated processes, such as Golden Software’s applications MapViewer, Grapher, and Scripter, the automation is achieved through scripts developed by users, and it is restricted to the selection of different chart styles to visualize the data.
In contrast, there are cases in the cartographic literature describing models of expert systems (Bollmann 1989; Forrest 1993) or knowledge-based systems (Mueller and Zeshen 1990; Zhang et al. 1992; Hutzler and Spiess 1993; Zhan and Buttenfield 1995) that automate the design of thematic maps. Bollmann designed a model (1989) in which the source data are analyzed, evaluated, and attributed with design and construction rules. Then, they are transferred into a digital map model, which is tested and corrected for the final modeling. Forrest (1993), on the other hand, describes the most basic model of an expert system as consisting of three main parts: the knowledge base (facts and rules), the inference engine (logic, procedures), and a user interface, adding also a database of relevant data. Additionally, he provides an overview of expert systems found in the literature, mainly covering three areas of interest: the design of map content and symbolization, the generalization, and the name arrangement.
In the knowledge-based system developed by Mueller and Zeshen (1990, 26), seven types of statistical maps—qualitative point and area maps, ordered point and area maps, proportional symbol maps, graphic maps (charts), and choropleth maps—were classified to help users “reach adequate decisions for the symbolic representation of statistical information based on physical or administrative units.” The representation of numerical data was limited to proportional symbol and choropleth maps, omitting other methods, in order to simplify the development of the model.
Zhang et al. (1992) developed the MAPKEY expert system for producing thematic maps. This system is based upon GIS, integrating a database, a knowledge base, and computer graphics for visualization. It covers almost all production steps of thematic mapping, such as data preparation, map type selection, data classification, symbol and color design, four-color separation, and film output.
In the knowledge-based system modeled by Hutzler and Spiess (1993), the entire procedure is automated, starting from the source data and the initial map requirements and finishing with the production of the final map through different rules based on a large amount of expert knowledge incorporated into the system. However, the user makes the crucial decisions during the process, based on the full knowledge of possible alternatives and options, thus reducing the danger of inappropriate solutions.
Zhan and Buttenfield (1995) have suggested an object-oriented, knowledge-based system for use in symbol selection (point, line, area) for the visualization of spatial statistical information. In this system, depending on the developed prototype, “the fundamental step was the specification of knowledge associated with symbol selection. Specification of knowledge includes the review of the cartographic principles for symbol selection and identification of the relevant decision processes” (296). However, this system does not generate a graphic output; it stops at symbol selection without defining its properties (e.g., color, size) and without helping the user produce the final map. Moreover, the system does not include any explanations to guide the user at each branching point; nor does it give information about the procedure or the different options that may exist at each step.
Complementary to the models implemented for these systems is the intelligent system designed by Dobesova and Brus (2012) for the interactive support of thematic map design. The project was focused on the development of a cartographic ontology that could facilitate the creation of the cartographic knowledge base of the system.
Keeping all the above in mind, expert systems in cartography incorporating formulated rules for every procedural step are very useful, since they allow users to concentrate on the application, relying on the system to generate representations that are cartographically logical. Our project also relies on this concept, but it mainly focused on designing a standardized workflow based on the analysis of cartographic principles and rules. We then developed a novel, rule-based wizard to guide users in creating thematic maps, which featured a hardcoded version of these cartographic rules.
BASIC CARTOGRAPHIC TERMS AND PRINCIPLES IN THEMATIC CARTOGRAPHY
In our attempt to design a standardized workflow to support the production of thematic maps, it is necessary first to analyze basic terms and principles established in thematic cartography. Based on this analysis, it is then possible to automate the selection of the appropriate visualization technique for a given map. This is the foundation for developing a rule-based wizard to guide users in creating the final thematic map.
For this reason, we analyzed the connections between the levels of data measurement (i.e., nominal, ordinal, and interval/ratio—including both absolute and relative values) and commonly used thematic mapping techniques (e.g., proportional or graduated symbols, charts, proportional or graduated or lines, isolines, isopleths, choropleths, bivariate mapping, etc.). For this survey of techniques, we drew upon a wide variety of sources (Stevens 1946; Witt 1967; Imhof 1972; Tobler 1973; Spiess 1978; Bertin 1983; Tyner 1992; Arnberger 1993; Dent 1996; Kraak and Ormeling 1996; Hake et al. 2002; Asche and Herrmann 2002; Slocum et al. 2005; Leonowicz 2006; Stern et al. 2011; Hurni 2012; Elmer 2013; Ormeling 2014).
Based on this analysis, we created Table 1 to summarize the different data types and their combinations with the spatial dimensions of geographic phenomena (point, line, area, volume) and their distributional forms (discrete, sequential, continuous). In each case, we suggest the proper mapping technique, as well as an explanation of where to place the emphasis on the visualization. As it shows, the same data may be represented by multiple mapping techniques, thus it is necessary to categorize these mapping techniques.
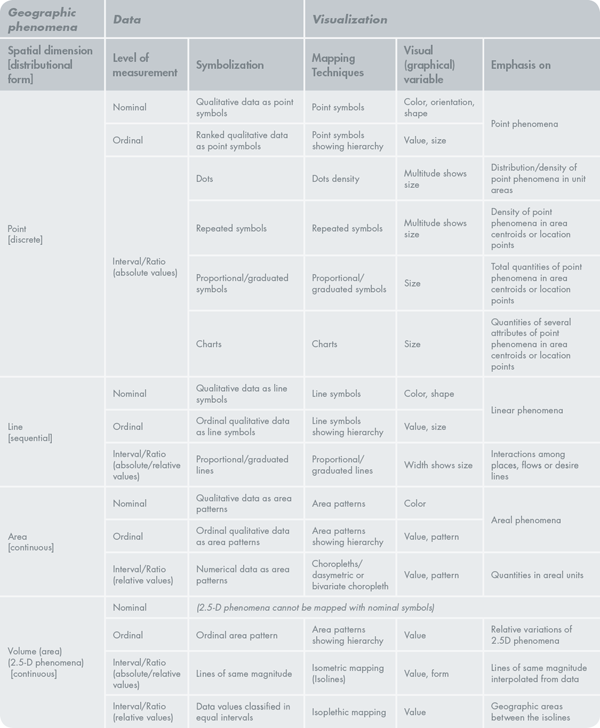
Table 1. Relationships between the properties of geographic phenomena (spatial dimensions and distributional form), data types, and appropriate thematic mapping techniques. (Dent 1996, 85; modified and adjusted by the authors based on Tyner 1992; Slocum et al. 2005; Hurni 2012; Ormeling 2014).
AUTOMATING THE SELECTION OF THE APPROPRIATE MAPPING TECHNIQUE BASED ON THEMATIC DATA ANALYSIS
Based on the analysis summarized in Table 1, we developed a new taxonomy of mapping techniques for standardizing the cartographic design of thematic maps and automating the selection of the appropriate technique that fits the data. This taxonomy is based on categorizing specific parameters of the different mapping techniques, taking into account their individual characteristics.
Defining parameters to select the appropriate mapping technique
The parameters that influence the selection of a suitable mapping technique are based on the data properties and spatial dimensions of the phenomenon to be visualized. The latter influences the geometry type that will be selected for visualizing the theme on the map.
The parameters describing the data properties are as follows:
- Nature of the geographic phenomenon that defines the map theme: point, line, area, or volume
- Level of measurement of the data: interval or ratio, since only numerical data were used in this study
- Number of attributes used to represent the theme
- Type of data values: absolute or relative
- Whether or not the data are classified
The parameters describing the spatial dimensions of the geographic phenomenon and the related visualization on the map are:
- Representation form of the phenomenon, which is connected to the theme of the map and defines its spatial dimensions: point, line, area, or volume
- The geometry used to depict the phenomenon on the map.
For example, the population of European countries (theme) may be represented with proportional symbols (representation form: point), linked to a geometry consisting of the polygons of the countries (geometry: polygon).
THE NEW TAXONOMY OF MAPPING TECHNIQUES
Based on the above-mentioned parameters, Table 2 shows our new taxonomy of mapping techniques and their characteristics of data type, representation type, and geometry type. It also shows the techniques that can be used to visualize multiple attributes at the same time (e.g., a chart), or techniques suitable for a combined representation of multiple attributes in different layers.
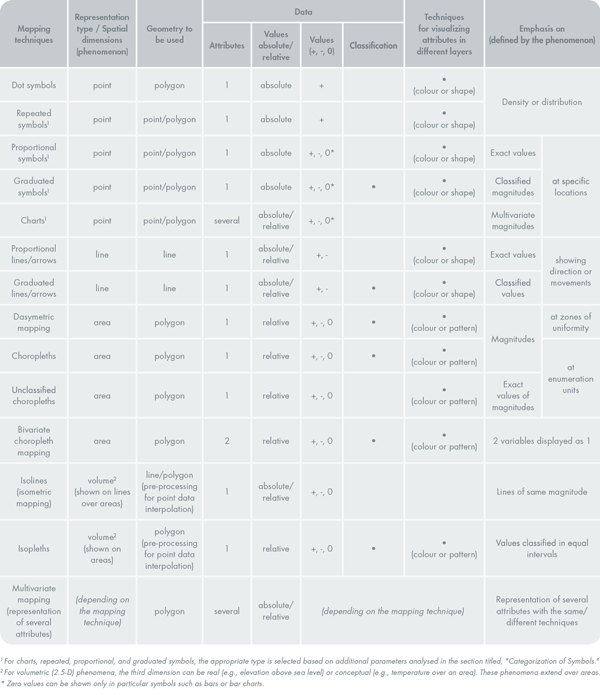
Table 2. The new taxonomy of mapping techniques and their characteristics.
At this point, our analysis indicates how to distinguish between the mapping techniques, in order to select the appropriate one. For techniques involving repeated, proportional, or graduated symbols, or involving charts, an in-depth knowledge of the symbol properties is required, because each symbol may express different characteristics of the original data. This additional categorization of symbols and charts eases the selection of the proper visualization technique in the wizard.
CATEGORIZATION OF SYMBOLS
In order to categorize the different symbols and the charts, we analyzed an extensive number of visualization types described in relevant cartographic literature (Witt 1967; Imhof 1972; Spiess 1978; Bertin 1983; White 1984; Arnberger 1993; Hake et al. 2002; Schnabel 2007a). Some particular styles of symbols or charts appear in the literature under multiple names. As an example, Figures 1 and 4 also include the terminology used by Brewer and Campbell (1998).
CATEGORIZATION OF REPEATED SYMBOLS
Density variations of phenomena in an area may be shown with dot symbols or repeated symbols. Figure 1 presents different types of repeated symbols, depicting one or several attributes as two- or three-dimensional representations.
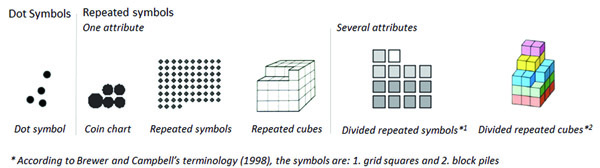
Figure 1. Dot symbols and repeated symbols depicting one or several attributes in 2D and 3D (Imhof 1972; Brewer and Campbell 1998; Schnabel 2007a).
CATEGORIZATION OF PROPORTIONAL OR GRADUATED SYMBOLS
Proportional (or graduated) symbols may be pictographic symbols, showing image-like representations of the corresponding elements, or geometric symbols, such as circles, squares, triangles, bars, etc. According to Dent (1996), the circle is the predominant form. In Figure 2, pictorial and geometric symbols are categorized. The size (area, height, or volume) changes proportionally to data values.
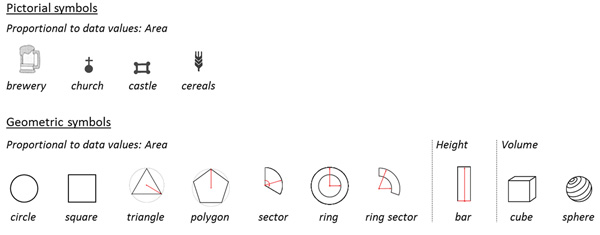
Figure 2. Pictorial and geometric symbols illustrate a phenomenon according to the proportional or graduated symbol techniques (Imhof 1972; Brewer and Campbell 1998; Slocum et al. 2005; Schnabel 2007a; 2007b).
CATEGORIZATION OF CHARTS
Charts are more sophisticated in design and construction than repeated and proportional symbols. Every chart has construction, style, and perceptive properties (Schnabel 2007a; Schnabel and Hurni 2009). Construction properties are based on a cartographic primitive: a point, line, or area. Style properties depend on the graphical variables used to represent the map symbol, while the perception properties are associated with the cognition of the map symbol by the user. Based on their construction properties, Schnabel (2007a; 2007b) described 49 categories of charts that can be found in thematic maps.
Following Schnabel’s categorization, but also taking the multivariate structure of data into account, we examined the properties of each chart and developed a new categorization, in which attributes are organized in groups (a chart has 1 or more groups of attributes that are compared). Other chart properties include its specific arrangement principle (polar, linear, perpendicular, or triangular), how its size changes in relation to data values (proportional to area, length, or volume), and whether the emphasis is on the size of the whole chart (e.g., a pie chart), or on that of each attribute separately (e.g., a wing chart). One final important chart property is whether it can represent data values of different signs (positive, negative, or 0 values). All of these properties are illustrated in Figure 3. Our new categorization of charts is shown in Figure 4.
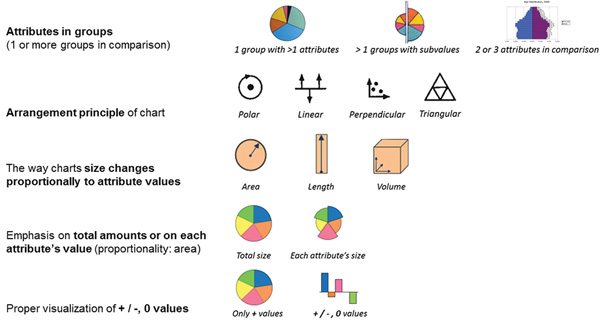
Figure 3. Parameters of charts as described by Schnabel (2007a).
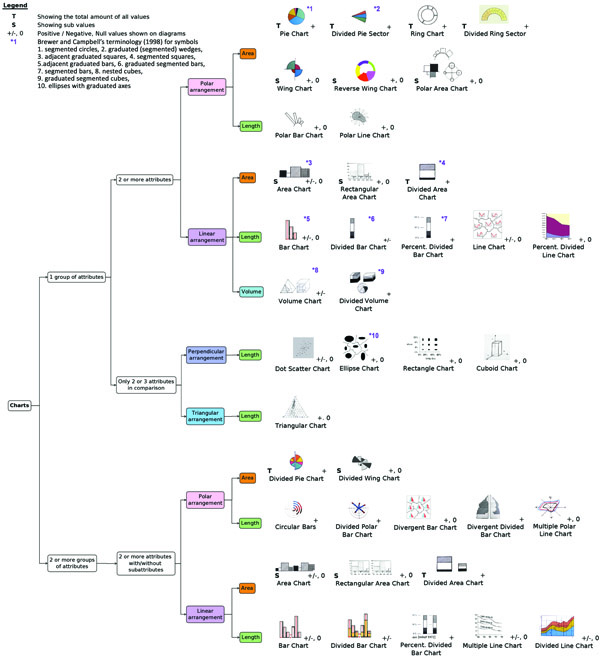
Figure 4. The new categorization of Schnabel’s 49 charts (Schnabel 2007a) based on the properties listed in Figure 3.
Based on these additional categorizations of charts, proportional symbols, and repeated symbols, supplementary conditions can be defined and used as criteria in the software wizard to automate the selection of an appropriate mapping technique for a thematic map.
SELECTING THE APPROPRIATE VISUALIZATION TECHNIQUE GUIDED BY A WORKFLOW
Our new taxonomy of mapping techniques, based on the examination of their various parameters above, facilitated the construction of the analytical workflow we mentioned previously. This workflow, which corresponds to the inference engine in an expert system (Forrest 1993), shows the process to follow and the parameters that influence the selection of the appropriate mapping technique (Figure 5).
![Figure 5. Workflow schema showing the process of selecting an appropriate mapping technique (B), beginning with the analysis of the statistical data (A, a–c) and the definition of the spatial dimensions of the geographic phenomenon [d]. The properties of each mapping technique [e] are also provided. Each technique is related to a specific geometry type [f]. Purple arrows and text show the special case of visualizing a multivariate phenomenon in different layers [g].](https://cartographicperspectives.org/index.php/journal/article/download/cp86-tsorlini-et-al/1526/7705?inline=1)
Figure 5. Workflow schema showing the process of selecting an appropriate mapping technique (B), beginning with the analysis of the statistical data (A, a–c) and the definition of the spatial dimensions of the geographic phenomenon [d]. The properties of each mapping technique [e] are also provided. Each technique is related to a specific geometry type [f]. Purple arrows and text show the special case of visualizing a multivariate phenomenon in different layers [g].
The workflow starts with the definition of the initial statistical data (Figure 5, A) and its properties (Figure 5, a–b). The parameters that must be defined first are the number of attributes needed for the representation of the theme (Figure 5, a), the type of data values (Figure 5, b), the classification of data, if necessary (Figure 5, c), and the representation type (Figure 5, d). By sequentially determining these parameters, it is possible to choose the technique(s) most appropriate to the selected data (Figure 5, B). If the workflow offers more than one technique, then a short description of each technique’s properties is presented (Figure 5, e) as decision support. Furthermore, the definition of the representation type (Figure 5, d) also determines the type of geometry data (Figure 5, f) that is used to visualize the map theme. For example, in order to create a map showing the population density on a continent (one attribute with relative, classified values) based on statistical data per country (representation type: area), the system recommends a choropleth representation. Dasymetric and isopleth mapping are other options that could be used, but they are not as suitable as choropleth mapping (see Table 2).
The workflow also offers techniques for visualizing multivariate geographic phenomena in different layers (Figure 5, g). In this case, the same mapping technique is used for each attribute separately. However, it is recommended not to choose too many attributes to be displayed on the same map, because its readability may be reduced. It is also possible to combine different mapping techniques that are based on “dissimilar” attributes on a thematic map, thus enriching the representation of the geographic phenomenon with additional information (Imhof 1972). In this case, techniques with different spatial dimensions may be “assembled”—for example, showing the production of cereals in an area as dot symbols and cereal imports and exports from the same area as percentages of overall production as choropleths.
Based on the process described by the workflow, we could next implement a software application, with a wizard as its main component, guiding the users step-by-step to create cartographically correct thematic maps.
DESIGNING THE WIZARD FOR CREATING THEMATIC MAPS
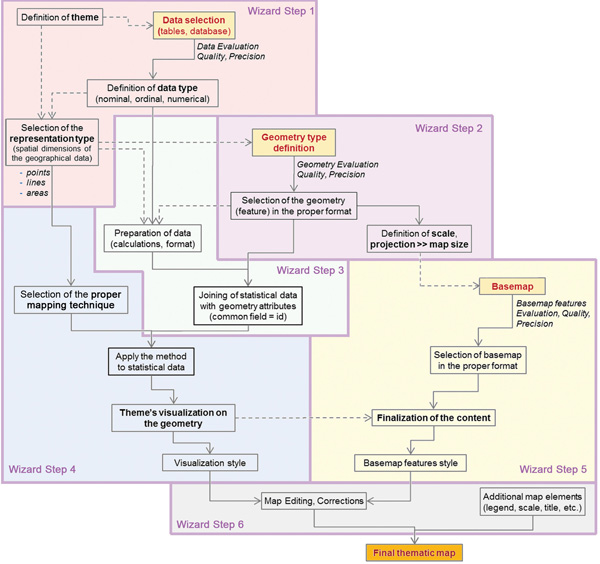
Figure 6. Workflow for the production of thematic maps, as implemented in the wizard. The beginnings of the three branches of the workflow (statistical data, geometry and base map features) are marked in yellow (Tsorlini et al. 2015).
To design and implement the software wizard, its main steps were first defined; their interactions with each other are described in the workflow in Figure 6. This workflow consists of three interdependent branches (marked in yellow). These are: (1) the statistical data, representing the theme of the map; (2) the geometry features (shapes), used to visualize the statistical data (theme) on the map; and (3) additional base map features (shapes), used to define and locate the area more precisely (Tsorlini et al. 2015). The six main steps of the procedure, which are also the steps of this wizard, are:
- Selection and analysis of the statistical data to represent the spatially distributed phenomenon on the map.
- Selection of the geometry features to be used for visualizing the statistical data, as well as definition of the scale and the layout properties of the map. Each geometry feature is linked to an attribute table containing descriptive information of all the elements.
- Joining of statistical data to the geometry through the geometry attribute table. The statistical data are suitably prepared so that every spatial feature is linked to the corresponding statistical data record. The two tables are joined using identical unique values (such as an ID number) included in specific fields.
- Selection of the appropriate mapping technique based on the data type, the spatial dimensions of the geographic phenomenon, and the correct symbolization of the features.
- Optional inclusion of base map features in the background of the map to depict the geographic area.
- Inclusion of a legend and other explanatory map elements, such as a scale, title, and other important map information.
The wizard was designed to simplify the whole procedure by gradually decreasing the number of available mapping techniques to those suitable for the data characteristics. Using this wizard, the user does not worry about all the cartographic principles and rules to be followed for the production of thematic maps.
Furthermore, in order to generate a cartographically correct thematic map, additional rules concerning the appearance of the map and the dimensions and position of the map symbols were integrated to the wizard. Each mapping technique is implemented in the wizard in such a way that it determines which visual variable (shape, color, value, and size) is used on the map to represent the geographic phenomenon. Additional cartographic rules for the overlapping of symbols or charts and the minimum dimensions for each symbol (Spiess 1970a; 1970b) were also included in the wizard, and colors were recommended for some techniques, such as choropleths. Special attention was given also to the design and the implementation of the legend, such that it was suitable for the special characteristics of each mapping technique. The inclusion of these additional rules in the system allows the generation of a final map that will not need a lot of processing to take its final form.
WIZARD-BASED CREATION OF A THEMATIC MAP: AN EXAMPLE
To give users a better understanding of the wizard’s design and function, the six-step structure is described on the initial page of the wizard. Then, the user starts the mapping procedure guided step-by-step by the wizard. The interface of each step of the wizard is presented in Figures 7–14, showing the different options the user has in each case.
- Step 1: Statistical data are loaded, the attributes to be visualized are selected, and their type is defined (Figure 7).
- Step 2: The geometry to be used for the visualization is selected, the map scale is entered, and the size and projection are defined (Figure 8).
- Step 3: The statistical data table is joined to the geometry attribute table through a field with common values (Figure 9).
- Step 4: The wizard suggests an appropriate mapping technique based on the user’s selection in the first step (Figure 10), augmented, if necessary, by additional information requested on a subsequent screen (Figure 11). Finally, the user defines the properties and style of the selected technique (Figure 12).
- Step 5: The user can upload supplementary base map features to complete the content of the map (Figure 13).
- Step 6: Additional map elements, such as a legend, title, scale, and other explanatory elements and text (Figure 14) may be added to the final thematic map (Figure 15). If necessary, small changes to the final appearance and the position of the map elements can be directly made to each layer. In the end, the final map can be exported in different formats and printed after defining the relevant options.
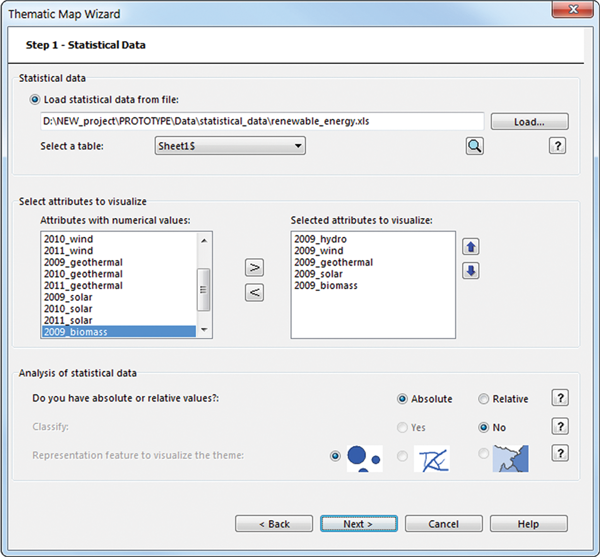
Figure 7. The first step of the wizard, where the statistical data are loaded. In this example, a map showing the production of renewable energy in Europe will be created by the wizard.
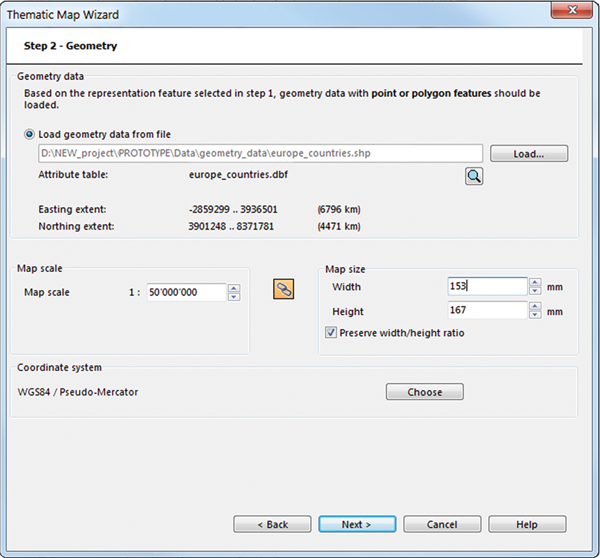
Figure 8. The second step of the wizard, in which the geometry used for theme’s visualization is loaded.
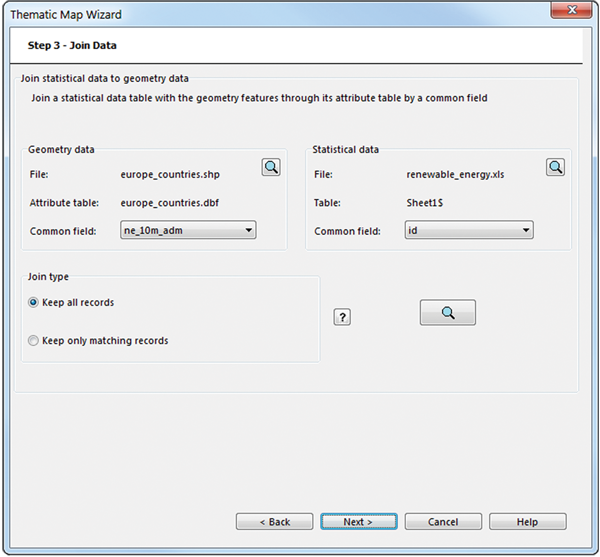
Figure 9. The third step of the wizard lets users join the statistical and geometry data.
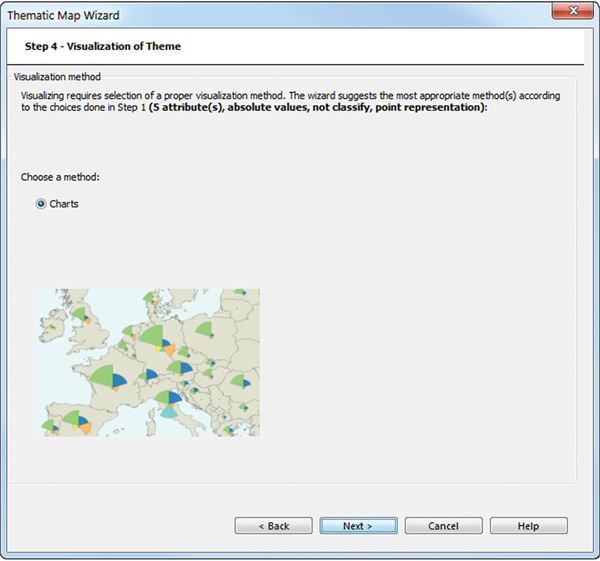
Figure 10. In the fourth step of the wizard, the most appropriate technique for the map is suggested. In this case, it is a chart representation.
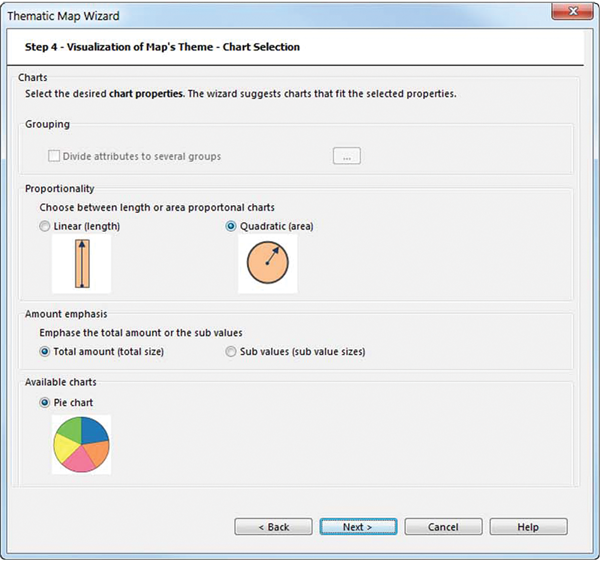
Figure 11. In order to find the proper technique, additional criteria for creating the charts must be entered in step four.
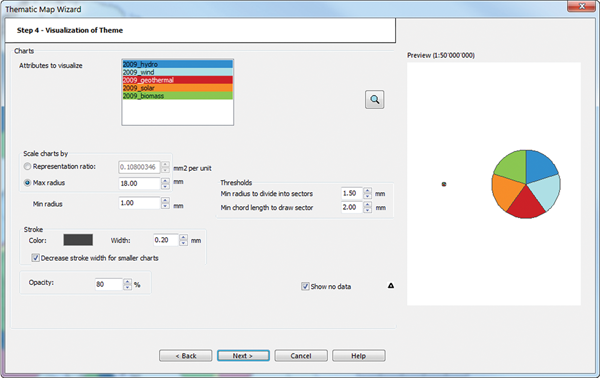
Figure 12. At the end of step four, users further define the symbolization attributes of the charts.
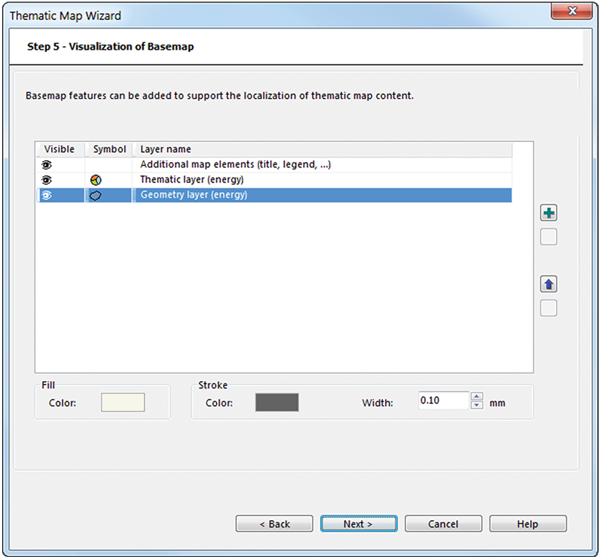
Figure 13. Additional base map features are inserted to complete the background of the map.
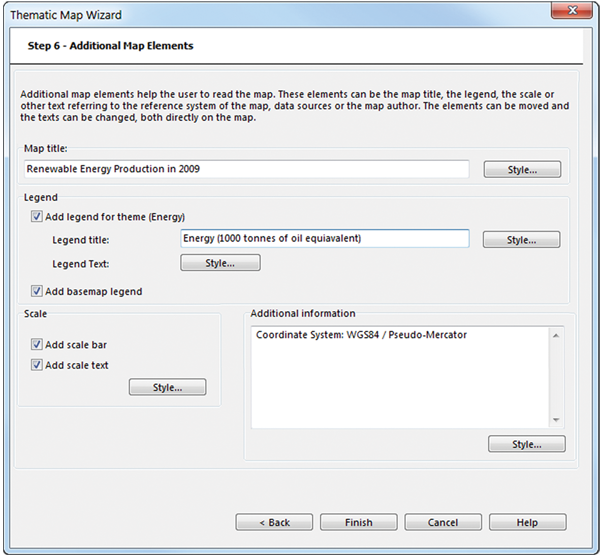
Figure 14. Explanatory elements and texts, such as a legend, scale, etc. are inserted to complete the map.
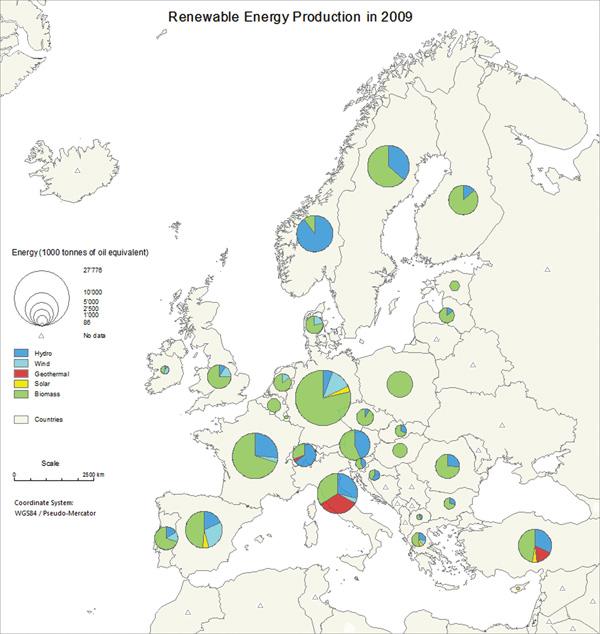
Figure 15. The final thematic map generated by the wizard, showing the renewable energy production in Europe in 2009.
The novel part of this wizard is that it automatically suggests the most appropriate mapping technique for the visualization of the data, based on the data property definition made in the first step. It also gives the user the opportunity to edit the statistical and attribute table within its environment, in order to create a field with identical unique values in both tables. This will then allow joining the tables.
Furthermore, throughout the entire procedure, the wizard provides information panels that explain the differences between the options and also show a preview of the selected data (Figure 16). If either the combination of choices made in preceding steps, or the input data, do not fulfill the specific criteria of the selected mapping technique, warning messages appear (Figure 17). These messages inform the user about inconsistencies and provide other options, which can lead to a better visualization of the theme. Moreover, in case there is more than one suitable mapping technique fitting the data definition made in the first step, the wizard informs the user about the differences between the techniques, helping them select the most suitable one and reach an adequate symbolization.
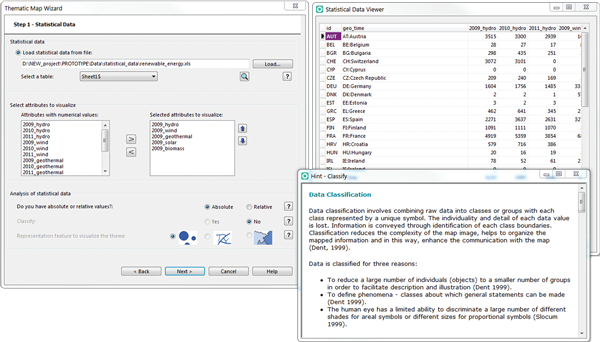
Figure 16. Panels provide information about data classification and a preview of the statistical table.
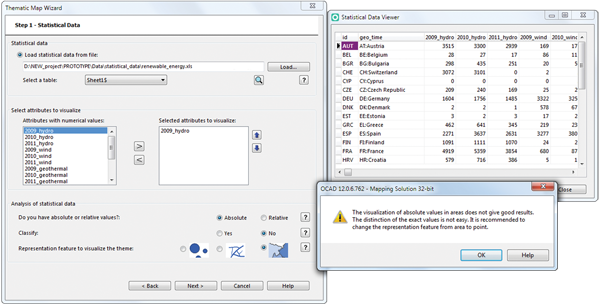
Figure 17. The warning message shown in this case informs the user that they have selected absolute values to visualize hydro energy over areas. This selection would lead to an improper visualization of the phenomenon.
EVALUATING THE WIZARD
The feasibility of the wizard was tested and evaluated in two qualitative studies conducted during the research and the implementation phase. Each was based on questionnaires, in which the users had to complete some tasks in order to create different types of thematic maps. The main goal of these studies was to test the practicality of the designed wizard, in order to see if it could correctly guide the users from step to step, providing them with the necessary information at every step. Ten people participated in the first study and thirteen in the second one. All of the participants created maps using different mapping techniques and answered questions concerning the structure of the steps. Additionally, they evaluated the actions they had to make in each step, along with the map the wizard generated for them, and then gave their overall impression of the process.
The participants had different levels of experience in cartography and the construction of thematic maps. Some of them were experts in cartography, geoinformatics, or geovisualization, and had worked for several years in these fields, while others were students currently attending relevant courses. For these two qualitative studies, twenty and twenty-six tests, respectively, were successfully completed on six different visualization techniques (proportional symbols, graduated arrows, choropleths, and three types of charts: wing, bar, and divided pie). The feedback clearly showed that the wizard could guide a user to select a proper mapping technique, simplifying the entire procedure and helping create a cartographically correct thematic map in a short time. Additionally, from their actions and comments we could see that users were generally satisfied with the generated map, making only minor changes to the colors they initially used or to the position of the explanatory map elements.
According to participants’ comments, the wizard’s suggestion of an appropriate technique for visualizing the selected data was helpful, especially for those who are not experts in thematic cartography. It saved them time in creating a thematic map based on cartographic principles and rules, which are normally only described in cartographic literature.
Additionally, participants regarded the information panels presented in every step explaining the different choices, as well as the warning messages appearing when an action deviated from an advisable workflow, as essential. These messages helped the users make proper decisions at each step and protected them from making serious mistakes during the production of the thematic map. More specifically, they informed the users about the type of geometry data necessary to use with the selected statistical data (step two), explained how statistical data could be joined with geometry data (step three), and, when multiple mapping techniques were appropriate, gave them hints that explained the differences between the types (step four; e.g., different types of charts).
The participants also found the parallel preview of the statistical table and the geometry’s attribute table, as well as the “on the fly” editing of the tables within the wizard, useful. This helps them to create a field with common values to connect the statistical and geometry data. This functionality is not included in most software; users are often obliged to first make the statistical data table compatible with the geometry table outside the software’s environment. We also received positive feedback for allowing users to save selections in an XML file; this file can be used to symbolize thematic and base map layers on future maps without having to start from scratch.
Among participants’ comments, especially during the first study, there were remarks indicating which parts of the wizard required further clarification or needed to be simplified. Based on these comments, the text of the information panels was simplified and formulated in a more comprehensible way during the implementation phase. More information panels were added to explain the different tasks and to help users select an appropriate technique and correctly define its properties. Diagrams were inserted to show the possible results of each option (e.g., the case of keeping all records, or only the matching records, when joining statistical data with geometry in step three). Pictures were included to show the different types of charts and their symbolization options (step four) and histograms to illustrate the different classification methods (step four).
During this phase, the features of each step’s interface were better arranged in the window, with our goal being to keep the wizard interface as simple as possible and requiring users to take the fewest possible actions. We also embedded tools controlling the locking of layers and the visibility of map features of the final map, in order to make the modification of map elements on the different layers easier. All the comments and users’ feedback played a significant role in the design and implementation of the wizard.
CONCLUSIONS AND DISCUSSION
The results of our qualitative studies, as well as the positive feedback from people who have started using it through the commercial cartographic software in which it has been integrated, show that the wizard is a useful tool for the production of maps based on statistical data. It actively guides the user to create proper thematic maps, suggesting the most appropriate mapping techniques for a specific data set, providing more information about data properties, and proposing alternative solutions. Moreover, the warning messages inform the users about erroneous decisions, guiding them toward creating cartographically correct thematic maps.
The thorough standardization of the cartographic procedure for creating thematic maps played a crucial role in developing each step of the wizard, as it included and combined all the important guidelines and rules to be taken into consideration. The analysis of each mapping technique’s properties, and their categorization based on data characteristics, were also critical for designing the wizard. Without this analysis and our new taxonomy of mapping techniques based on their individual characteristics, it would have been difficult to automate the selection of the proper technique in a wizard. The use of a rule-based wizard, which guides the users step-by-step in creating proper thematic maps, is beneficial for mapmakers, whether or not they are experts in thematic cartography, since it allows them to create thematic maps in a short time while being sure that the final result will follow the cartographic principles and rules that lead to correct map representations.
The workflows that we created to systematize the entire procedure are generic and applicable also to other cases involving the creation of thematic maps. Moreover, the analysis of the cartographic rules and principles to automate the procedure may be also useful to scholars and students for understanding the parameters and the cartographic procedure of creating thematic maps.
ACKNOWLEDGEMENTS
This work was supported by The Commission for Technology and Innovation (CTI) of Switzerland and OCAD Inc.; and is part of the joint project “OCAD Thematic Mapper — Generic Thematic Map Generation with Wizards” conducted by OCAD Inc. and the Institute of Cartography and Geoinformation, ETH Zürich.
REFERENCES
Arnberger, E. 1993. Thematische Kartographie. Braunschweig: Westermann.
Asche, H., and C. Herrmann. 2002. “Thematic Cartography.” In Basic Cartography for Students and Technicians, Volume 2, edited by R. W. Anson and F. J. Ormeling, 123–150. Great Britain: Butterworth-Heinemann.
Bertin, J. 1983. Semiology of Graphics. Madison, WI and London: University of Wisconsin Press.
Bollmann, J. 1989. “Ansätze zur Automatisierung von kartographischen Konzeptions- und Gestaltungsprozessen.” Wiener Schriften zur Geographie und Kartographie 2: 140–151.
Brewer, C., and A. J. Campbell. 1998. “Beyond Graduated Circles: Varied Point Symbols for Representing Quantitative Data on Maps.” Cartographic Perspectives 29: 6–25. doi: 10.14714/CP29.672.
Dent, B. D. 1996. Cartography: Thematic Map Design, 4th edition. Dubuque, IA: William C. Brown.
Dobesova, Z., and J. Brus. 2012. “Intelligent Systems in Cartography.” In Intelligent Systems, edited by V. Koleshko, 257–276. Rijeka, Croatia: InTech. doi: 10.5772/35860.
Elmer, M. 2013. “Symbol Considerations for Bivariate Thematic Maps”. In Proceedings of 26th International Cartographic Conference. Dresden, Germany: ICA. http://icaci.org/files/documents/ICC_proceedings/ICC2013/_extendedAbstract/278_proceeding.pdf.
Forrest, D. 1993. “Expert Systems for Cartographic Design and Symbolisation.” Cartographic Journal, 30 (2): 143–148. doi: 10.1179/000870493787860049.
Hake, G., D. Grünreich, and L. Meng. 2002. Kartographie, 8th edition. Berlin: Walter de Gruyter.
Hurni, L. 2012. Methoden thematischer Darstellung. Lecture Notes. Zürich: ETH Zürich.
Hurni, L., and E. Hutzler. 2008. “Implementation Kartographischer Funktionen als Adobe Illustrator – Plug-ins.” Kartographische Nachrichten 58 (5): 248–255. http://www.ika.ethz.ch/plugins/publi/pdf/KN_5_2008_Illustrator_Plugins.pdf.
Hutzler, E., and E. Spiess. 1993. “A Knowledge-Based Thematic Mapping System — the Other Way Round.” In Proceedings of the 16th International Congress on Cartography, 329–340. Cologne, Germany: ICA.
Imhof, E. 1972. Thematische Kartographie. Berlin: Walter de Gruyter. doi: 10.1515/9783110826111.
Kraak, M. J., and F. Ormeling. 1996. Cartography: Visualisation of Geospatial Data. Essex: Addison-Wesley Longman Ltd.
Leonowicz, A. 2006. “Two-variable Choropleth Maps as a Useful Tool for Visualisation of Geographical Relationship.” Geografija 42 (1): 33–37. http://elibrary.lt/resursai/LMA/Geografija/Geog_033_037_spalvotas.pdf
Mueller, J. C., and W. Zeshen. 1990. “A Knowledge Based System for Cartographic Symbol Design.” Cartographic Journal 27 (1): 24–30. doi: 10.1179/000870490786961843.
Ormeling, F. 2014. “Thematic Maps.” In The World of Maps, e-book for International Map Year 2015–2016, edited by IMY Working Group of ICA. http://mapyear.org/files/wom/06_IMY_WoM_en.pdf.
Schnabel, O. 2007a. Benutzerdefinierte Diagrammsignaturen in Karten. Konzepte, Formalisierung und Implementation. PhD diss., ETH Zürich. http://e-collection.library.ethz.ch/eserv/eth:29352/eth-29352-02.pdf.
———. 2007b. “Diagrammformen in Karten.” CartouCHe - Cartography for Swiss Higher Education. http://www.e-cartouche.ch/content_reg/cartouche/cartdesign/en/image/them_map/diagrammformen_schnabel2007.pdf.
Schnabel, O., and L. Hurni. 2009. “Primitive-based Construction Theory for Diagrams in Thematic Maps.” Cartographic Journal 46 (2): 136–145. doi: 10.1179/000870409X459851.
Slocum, T. A., R. B. McMaster, F. C. Kessler, and H. H. Howard. 2005. Thematic Cartography and Geographic Visualization, 2nd edition. Upper Saddle River, NJ: Prentice Hall.
Spiess, E. 1970a. “Base Map Types for Thematic Maps.” Presented at the 6th United Nations Regional Cartographic Conference for Asia and the Far East, Tehran, Iran, October 24–November 7, 1970.
———. 1970b. “The Need for Efficient Base Maps in Thematic Mapping.” Presented at the Fifth International Conference on Cartography, Stresa, Italy, May 10–14, 1970.
———. 1978. “Graphische und technische Aspekte bei der Konzeption thematischer Karten.” Kartographische Schriftenreihe 3: 63–78. Bern: Schweizerische Gesellschaft für Kartographie. http://www.kartographie.ch/publikationen/pdf/nr03_thematische_kartographie_1978.pdf.
Stevens, S. S. 1946. “On the Theory of Scales of Measurement.” Science 103 (2684): 677–680. www.jstor.org/stable/pdf/1671815.pdf.
Stern, B., L. Hurni, S. Wiesmann, and Y. Ysakowski. 2011. “Statistics for Thematic Cartography.” Geographic Information Technology Training Alliance – GITTA. http://www.gitta.info/Statistics/en/text/Statistics.pdf.
Tobler, W. 1973. Choropleth Maps without Class Intervals. Geographical Analysis 5 (3): 262–265. doi: 10.1111/j.1538-4632.1973.tb01012.x.
Tsorlini, A., L. Hurni, R. Sieber, T. Gloor, and H. Klauser. 2015. “Generation of Thematic Maps with Wizards based on Cartographic Principles: The Case Study of OCAD Thematic Mapper.” In Proceedings of the 27th International Cartographic Conference. Rio de Janeiro: ICA. http://icaci.org/files/documents/ICC_proceedings/ICC2015/papers/9/367.html.
Tyner, J. 1992. Introduction to Thematic Cartography. Upper Saddle River, NJ: Prentice Hall.
Valent, T. 2010. Programování nadstavby pro tvorbu kartodiagramů v ArcGIS. Diploma thesis. Palacký University, Olomouc. http://www.geoinformatics.upol.cz/dprace/magisterske/valent10/index.php?page=diagram.
Werner, M., and E. Hutzler. 2006. “Contemporary Map Design with Desktop-Publishing System Extension.” Wiener Schriften zur Geographie und Kartographie 17: 224–223. http://www.ika.ethz.ch/plugins/publi/pdf/2006_werner_hutzler.pdf.
White, J. V. 1984. Using Charts and Graphs: One Thousand Ideas for Getting Attention Using Charts and Graphs. New York and London: R. R. Bowker Company.
Witt, W. 1967. Thematische Kartografie - Methoden und Probleme, Tendenzen und Aufgaben. Hannover: Gebrüder Jänecke Verlag.
Zhan, F. B., and B. P. Buttenfield. 1995. “Object-oriented Knowledge-based Symbol Selection for Visualizing Statistical Information.” International Journal of Geographical Information Systems, 9 (3): 293–315. doi: 10.1080/02693799508902038.
Zhang, W., B. Su, H. Li, and X. Zhang. 1992. “A Knowledge-based System Approach to Thematic Mapping.” In Proceedings of XVIIth ISPRS Congress Technical Commission IV: Cartographic and Data Base Applications of Photogrammetry and Machine Vision, 580–584. http://www.isprs.org/proceedings/XXIX/congress/part4/580_XXIX-part4.pdf.
SOFTWARE APPLICATIONS
ArcGIS, Esri: esri.com
Adobe Illustrator Plug-ins for Cartographic Composition, Institute for Cartography and Geoinformation, ETH Zürich, Switzerland: ika.ethz.ch/plugins/index.html
CARTO: carto.com
Cartovista, DBx Geomatics: cartovista.com
Indiemapper, Axis Maps: indiemapper.io
Maptitude Mapping Software, Caliper Corporation: caliper.com/maptovu.htm
MapViewer, Grapher, and Scripter, Golden Software: goldensoftware.com
QGIS: qgis.org
Statplanet, StatSilk: statsilk.com
Regiograph, GfK GeoMarketing GmbH: regiograph.gfk.com
Thematic Mapping API, Bjørn Sandvik: thematicmapping.org/api
Thematic maps in Excel: excelcharts.com/blog/how-to-create-thematic-map-excel