DOI: 10.14714/CP89.1429
The Status of Web Mapping in North American Higher Education
Carl M. Sack, Fond du Lac Tribal and Community College | carl.sack@fdltcc.edu
Most maps are now consumed online, yet colleges and universities struggle to keep their cartography and GIScience curricula up to date with the use of modern web technologies. I present a qualitative interview study aimed at providing insight into current teaching practices, along with challenges that may hamper the uptake of web mapping technologies in the classroom. The study involved interviews with 20 instructors of web mapping courses at colleges and universities in the United States and Canada. Participants were asked about the overall vision for their web mapping courses, the scope of material covered, what specific topics are included, which web technologies they use and why, their preferred teaching pedagogy, and what challenges they have experienced. The results highlighted several strategies that cartography and GIS instructors can use to implement or increase the inclusion of web mapping in their curricula.
KEYWORDS: web mapping; higher education; teaching; JavaScript; coding; interactive maps; interviews
INTRODUCTION
Maps and mapping have changed drastically over the past decade or so. The invention of the smoothly interactive tile-based web map in 2005 heralded a major shift in public map consumption from paper to digital (Crampton 2010; Peterson 2014). Today, far more maps are consumed via the internet than in hard copy form. For example, Apple Maps served more than 5 billion map requests per week in 2015, and more than 4.6 million websites currently embed Google Maps (Jesdanun 2015; Built With 2017). Even most static maps that once would have been printed are now viewed as image or PDF files in the browser. In geography classrooms, web mapping is increasingly seen as a vital tool for supporting spatial thinking (Manson et al. 2014).
Creating web maps requires at least basic web development and programming skills, yet university geography departments lag in teaching these skills. Most cartography and GIS programs continue to focus on the use of push-button desktop software with little text-based coding instruction (Bowlick, Goldberg, and Bednarz 2017). The purpose of the research reported here is to better understand the current state of educational practice, as well as methods for expanding the teaching of web mapping in higher education. I report on an analysis of interviews with 20 instructors of web mapping courses regarding their teaching goals, tools, and methods. A basic understanding of web map infrastructure is necessary to interpret the findings of the study. Explanations of the technology and its impact on cartography in higher education follow below.
TECHNICAL BACKGROUND
The growth of web maps has been enabled by a series of innovations in internet technologies. All web maps make use of the internet’s client-server architecture, wherein data are stored in files or a database on a host machine and transmitted by a piece of software (the server) to the user’s web browser (the client) (Peterson 2008; Manson et al. 2014). The first web maps were simply static images of maps placed online as early as 1993, as soon as images could be displayed in a web browser (Peterson 2014). Interactive web maps, or maps that change in response to user input, were established shortly thereafter with the development of specialized map servers that could transmit specific geographic data or pre-rendered map images requested by the user.
During the 2000s, interactive web maps split between those rendered in formats native to the web browser and those developed for third-party browser plugins (Roth et al. 2014). In the former category, services such as MapQuest and TerraServer provided maps that the user could zoom and pan via interface buttons that would reload the web page with a new map view after each interaction (Peterson 2014). In 2005, Google engineered a major breakthrough with the launch of its Maps service, which relied on Asynchronous JavaScript and XML (AJAX) to load 256-by-256-pixel map image tiles as they were requested by the client, without reloading the entire web page (Peterson 2012). This afforded the user smooth, intuitive zooming and panning. This remains the most common type of interactive web map, often called a “slippy map.” In addition, the Google Maps API, launched in 2006, allowed tech-savvy users to add their own data as marker or vector feature overlays atop a Google basemap, and retrieve information from features via pop-ups (Crampton 2010). Other commercial services and the open source OpenLayers API followed suit.
The other type of interactive web maps commonly developed in the 2000s were those for third-party browser plugins such as Adobe Flash Player and Microsoft Silverlight (Peterson 2008). These were integrated into commercial software development environments and produced as binary executable files that ran once fully downloaded by the client (Roth et al. 2014). This strategy was advantageous for users with low bandwidth connections, providing smooth interaction without requiring constant communication between server and client. The graphics were also of superior quality to those that could be rendered directly in early web browsers (Jenny, Jenny, and Räber 2008).
However, browsers eventually caught up in their rendering and interaction capabilities. They developed universal support for the open web language standards of CSS (Cascading Style Sheets) for page styling, SVG (Scalable Vector Graphics) for vector image rendering, HTML5 for content layout, and JavaScript for programming tasks (Roth et al. 2014; also see Figure 1). Higher bandwidths also became increasingly prevalent in the developed world (Lienert et al. 2012; Nielsen 2016). Additionally, the World Wide Web Consortium (W3C) promoted a shift away from proprietary, third-party technologies toward free and open source (FOSS) tools based on open web standards that ensured royalty-free use and modification (Lund 2017). In 2010, mobile device manufacturers announced they would discontinue support for third-party plugins in mobile browsers, precipitating the deprecation of these technologies in favor of sole reliance on open web standards (Jobs 2010; Adobe Corporate Communications 2015).
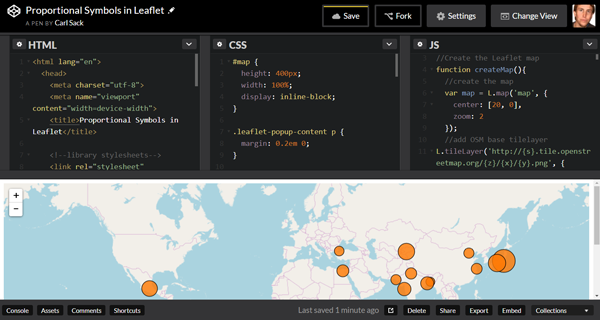
Figure 1. Screenshot of an online web development application (Codepen.io) showing examples of the three basic open web platform languages: HTML, CSS, and JavaScript. The code contained in the three panels works together with external code libraries to generate the interactive web map at the bottom. The circles on the map are generated dynamically using the SVG graphics format (not shown as code).
Concomitant with this shift has been a rapid growth in the diversity and flexibility of web mapping technologies. Open source JavaScript libraries such as Leaflet and D3, which consist of sharable and editable code to facilitate easier web map construction, have come into widespread use. Many commercial platforms such as Google continue cutting edge feature adoption (Peterson 2014). Full-stack web mapping and web GIS platforms—web applications that include both server- and client-side program components—such as Mapbox, CARTO, and ArcGIS Online have become more available, powerful, and usable, such that it is now possible to make and share a reasonably high quality custom web map and even perform advanced spatial analysis operations with a few mouse clicks in the browser (Kerski et al. 2012; Muehlenhaus 2014). Because these services rely on open web standards, the appearance and functionality of web maps created with them can be further customized by anyone with basic coding skills (Sack 2017).
HIGHER EDUCATION BACKGROUND
The shift to open web technologies in cartography has echoed a similar shift in higher education toward greater usage of web-based instructional technologies and resources (Bozkurt et al. 2015). Online education programs continue to grow rapidly, with 32% of all U.S. higher education students taking at least one distance education course and 15% taking exclusively distance courses in 2016, while overall higher education enrollment has declined annually since 2012 (Seaman et al. 2018). In the United States, community and technical colleges offering two-year associate degree programs, and universities offering four-year baccalaureate programs, receive a 34% share of federal government spending on workforce development (Fain 2017). Canadian universities likewise see much of their mission as training graduates to meet labor market needs (Davidson and Soubry 2014). With the rapid rise of information technology in all sectors of the economy, this job training looks increasingly web-focused as well as web-enabled (Atkinson 2016).
The number of distance education programs in GIScience is growing as universities aim to capitalize on the demand by working adults for professional retraining and flexible, location-independent course structures (Robinson and Nelson 2015). These notably include fully online degree programs in web mapping and GIS at The Pennsylvania State University, the University of Kentucky, and the University of Wisconsin–Madison, to name a few, which leverage web-based content management systems to combine written and multimedia content modules with real-time instructor support for student learning (Luo, Robinson, and Detwiler 2014). Such programs necessarily teach web mapping, as the web is their entire medium for instruction and assessment of cartography skills, but also recognize that interactive web mapping skills are currently in demand by employers and GIS professionals (UW–Madison 2017).
While these programs are on the cutting edge of web mapping education, a cursory review of course offerings listed on North American cartography and GIS program websites suggests that those offering courses in web mapping continue to make up the minority. Research into technology adoption in higher education suggests a range of possible factors, including the complexity of web technologies, resistance to change, lack of motivation, lack of institutional support, lack of faculty time and resources, and/or negative experiences in prior attempts (Moser 2007; Abrahams 2010). The New Media Consortium categorizes these challenges as “managing knowledge obsolescence” and calls for the establishment of “processes . . . for both technology and pedagogy discovery so higher education professionals can filter, interpret, organize, and retrieve information in an efficient and insightful manner” (Adams Becker et al. 2017, 23).
Nonetheless, there have been promising developments. With a recent update, the Geographic Information Science and Technology Body of Knowledge—the authoritative collection of GIScience education standards—now includes several web mapping-related topics, including UX/UI Design Principles, Web Mapping, Virtual and Immersive Environments, Mobile Mapping and Responsive Design, and Usability Engineering (UCGIS 2017). An increasing number of programs are integrating web mapping into their existing courses or creating new courses focused specifically on web mapping (Hermansen 2010). A critical mass of courses that would tip the scales toward universal adoption of web mapping in cartography and GIS curricula may not be far off (Abrahams 2010). My aim here is to hasten its arrival by increasing the awareness of the teaching strategies used by early adopters as well as the challenges they have faced in the process of learning to teach web mapping.
METHODS
The research study reported here consisted of one-hour interviews with instructors of web mapping courses at colleges and universities across the United States and Canada, conducted between August 2016 and April 2017. Potential participants were identified first by emailing faculty at institutions listed in the North American Cartographic Information Society’s (NACIS) University Labs directory (nacis.org/community/university-labs). Additional potential participants were added based on recommendations of those who responded to the first round of emails. Finally, a general recruitment email was sent to the American Association of Geographers (AAG) Cartography Specialty Group listserv in advance of the 2017 AAG Annual Meeting.
Through this process, 92 potential participants were identified, of whom 22 agreed to an interview, a positive response rate of 24%. There was no noticeable correlation between those who responded and their geographic location, specialty, or institution type. Eighteen of those identified as potential participants responded but declined to be interviewed: four because they were not academic instructors, six because they did not currently teach web mapping, one due to lack of time, and seven for unspecified reasons. Twelve of those who declined forwarded the invitation or recommended colleagues who they thought would be better candidates.
Participants were considered to meet the study criteria if they had been an instructor of record for one or more courses that taught students how to create an interactive web map. Of the 22 interviews recorded, two were ultimately discarded because the participants did not meet the study criteria, resulting in a total sample size of 20. Of these, seven interviews were conducted in person at the NACIS and AAG meetings, and the remaining 13 were conducted by phone or video conference. The interviews were audio-recorded and transcribed in full.
A semi-structured format was used for the interviews, providing consistency in participant answers while allowing for more natural conversation and follow-up questions on themes that were of particular interest to participants (Bozkurt et al. 2015). The interview protocol included questions on
- the background and training of the instructor;
- the scope and sequence of topics covered by their web mapping course or courses;
- the tools and technologies they relied on for teaching web mapping;
- their attitudes toward proprietary and FOSS software;
- their observations as to industry trends in web mapping technology and practice;
- the extent to which they taught the class in person, online, or using a blended approach;
- their use and creation of open educational resources;
- their preferred teaching pedagogy;
- successes and challenges they had experienced with teaching web mapping; and
- any techniques they identified as “best practices” for teaching web mapping.
Interview transcripts were coded for qualitative data analysis using 26 descriptive codes across five categories of statements including the overall course context, technology used in the course, resources used in teaching the course, the course setting (i.e., whether in-person, online, or blended), the curriculum content, and teaching philosophy and experiences (Table 1). The coding scheme began as a list of 22 codes that were inductively revised and added to during transcript analysis and discussions between the two coders referenced below (Miles, Huberman, and Saldaña 2014). For each final code, the statements assigned that code were further grouped according to theme across all transcripts, with each theme’s frequency and extensiveness recorded. These themes are presented in the Results section.
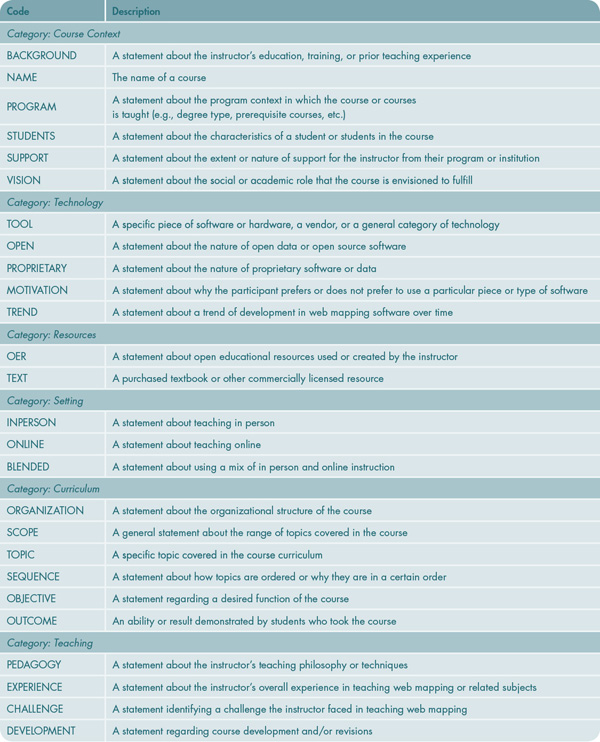
Table 1. Interview coding scheme.
To validate the qualitative analysis, 25% of the transcripts (5 out of 20) were independently coded by two coders. The primary coder analyzed all 20 transcripts, while a secondary coder re-analyzed five of the transcripts to produce an inter-rater reliability score. The overall results produced a Cohen’s Kappa score of 0.50, or moderate agreement (Hallgren 2012). This analysis included statements for which a code was generated by one of the two coders with no corresponding code given by the second coder. Excluding such one-sided codes produced a Cohen’s Kappa score of 0.78, or substantial agreement.
Based on the results of the coding analysis, the codes VISION, SCOPE, TOPIC, TOOL, MOTIVATION, PEDAGOGY, and CHALLENGE were subjectively judged to contain the most salient collections of statements pertaining to the goals of the study outlined above. Themes from statements tagged with each of these codes were identified and tallied according to the frequency and extensiveness with which the theme recurred across all 20 transcripts. It is important to note that each interview received multiple (sometimes many) themes for each code, so these themes should not be considered mutually exclusive. Themes that recurred in multiple transcripts are reported in the Results section below.
RESULTS
The results of the qualitative analysis are presented below as a series of tables containing the themes for each code that were expressed in statements by two or more interview participants (i.e., were present in at least 10% of transcripts).
VISION
The VISION code was applied to statements about the big-picture social or academic role that the instructor imagined the course as fulfilling. VISION themes discussed by multiple instructors are reported in Table 2.
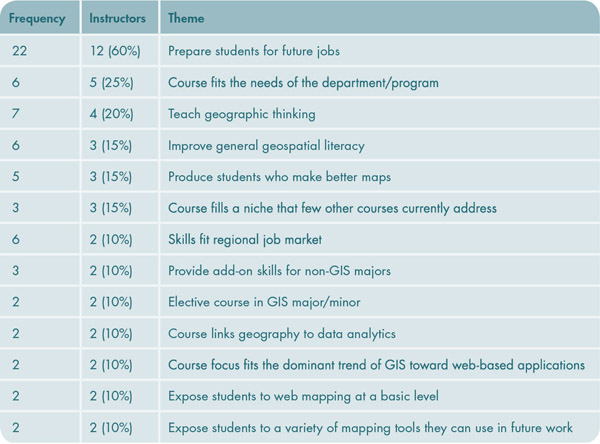
Table 2. VISION themes expressed by two or more interview participants.
Instructor visions mostly pertained to employable skills. The majority of web mapping instructors saw preparing students for future jobs as their major purpose in teaching the class. Related themes of meeting regional job market demand, providing add-on skills for non-majors, following trends in the GIS industry, and exposing students to tools they could use in their future work were each mentioned by two instructors. Five instructors taught the course because it fit the particular needs of their department or program, while three saw the course as filling an open niche. Four instructors saw web mapping as a useful way to teach students how to think geographically, and three each wanted to improve geospatial literacy and produce students who make better maps.
SCOPE
The SCOPE code was applied to statements about the overall range of topics or themes covered in the course. SCOPE themes discussed by multiple instructors are reported in Table 3.
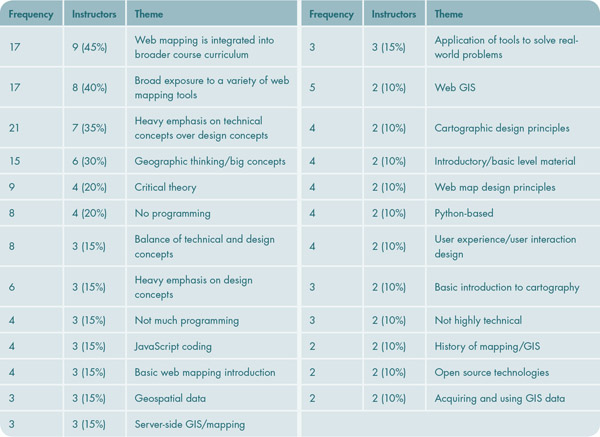
Table 3. SCOPE themes expressed by two or more interview participants.
The SCOPE code revealed clear divides in the depth to which instructors teach web mapping and whether it is the primary content of the course or a sidebar in a larger curriculum. Just under half of participants stated that their courses focused on a broader geography, cartography, and/or GIS curriculum into which they integrated web mapping skills. Eight participants said they exposed students to a wide variety of web mapping tools throughout the course. Seven stated that they maintained a heavy emphasis on teaching technical concepts, in keeping with the vision of web mapping as a career skill. Three reported that they sought to balance technical and design concepts, and three said they emphasized design heavily.
However, six reported going in a different direction entirely, using web mapping as a platform for encouraging students to think critically or explore a “big idea,” and four said they used it to explore critical geographic theory. Although most participants considered programming an important web mapping skill, only three mentioned a focus on JavaScript coding, while four said they included no programming at all in their courses and three specified that they taught very little or only a very basic level of it. Three discussed covering geospatial data and three discussed teaching server-side mapping and GIS.
TOPIC
The TOPIC code was more granular still than either VISION or SCOPE, examining specific topics that were covered during units of the course curriculum. Participants covered a very wide variety of topics in their curricula, with almost every course seemingly unique. While this lack of cohesion could be judged negatively, one participant saw it as a positive, stating, “I would hate there to be a standard curriculum, so that everybody gets a very generic view of what cartography is. . . . The more variety, the better.” Because this variety made for a great many separate themes, only those common to three or more participants are reported in Table 4.
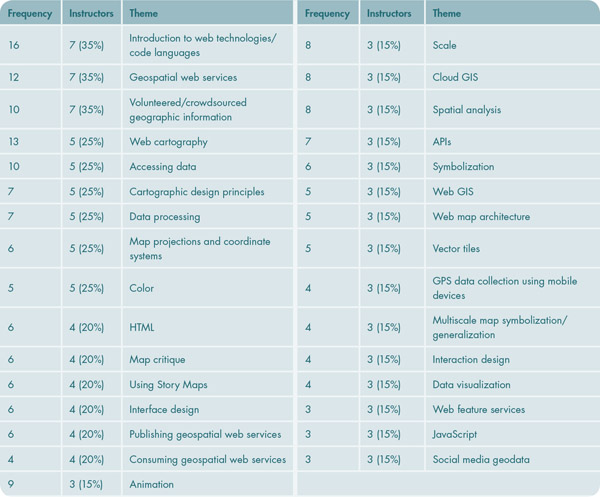
Table 4. TOPIC themes expressed by three or more interview participants.
Despite the lack of emphasis on coding in the SCOPE themes, the most frequently mentioned topic was a basic introduction to web languages and technologies. Geospatial web services was also mentioned as a topic by seven participants, while four each spoke more specifically about teaching how to either produce or consume these services. Crowdsourced data and volunteered geographic information (VGI) was also a common topic. Topics mentioned by fewer people included a mix of traditional cartography and GIS topics and topics more specific to web mapping practices.
TOOL
The TOOL code was the most granular of all, applied to a specific piece of software, hardware, general category of technology, or vendor name. Participants mentioned using almost 200 different tools. Table 5 presents all 68 tools that were mentioned by two or more participants.
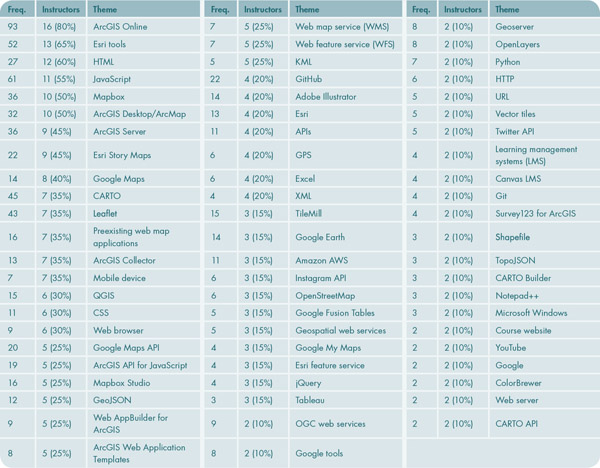
Table 5. TOOL themes expressed by two or more interview participants.
One thing is clear from this analysis: ArcGIS Online is king. Sixteen out of 20 participants made use of it to teach web mapping skills. Other Esri products are distributed throughout the left-hand side of the table, showing that vendor’s current dominance in the web map marketplace. Thirteen participants mentioned Esri tools in general, ten discussed using ArcGIS Desktop/ArcMap, nine each used Story Maps and ArcGIS Server, seven used the Collector mobile app, five each used Esri’s Web AppBuilder, JavaScript API, and web application templates, four mentioned Esri as a vendor, and three used Esri feature services. Half of participants (10) used Mapbox, making it Esri’s top competitor as a proprietary web mapping service supplier; five also mentioned Mapbox Studio, that vendor’s flagship web mapping interface. In the same category, Google Maps was used by eight participants, with its API taught by five, and various other Google products gaining a few mentions each. CARTO was used by seven, with its Builder application and API each mentioned by two. Leaflet, the most widely-used open source web mapping API, was taught by seven participants. Six participants used QGIS, an open source desktop GIS platform.
Many participants also covered web languages in their courses. HTML and JavaScript were mentioned by 12 and 11 participants, respectively, while CSS was mentioned by six. Of web standard geospatial data formats, GeoJSON was used by five participants, and KML and XML were each used by four. Geospatial web services were also popular, with WMS and WFS each mentioned by five and the broader category of OGC services to which those belong discussed by two. Two participants mentioned teaching students about vector tiles, which are used by Mapbox and Google for their tile services (and can now be produced by Esri’s ArcGIS Pro and ArcServer). While no one specifically mentioned raster map tiles, three participants mentioned using TileMill, an open source desktop application that creates them.
MOTIVATION
The MOTIVATION code was applied to statements regarding why the participant chose to use a particular tool in their course. The 42 themes in Table 6 provide context for the prevalence or absence of tools listed in Table 5.
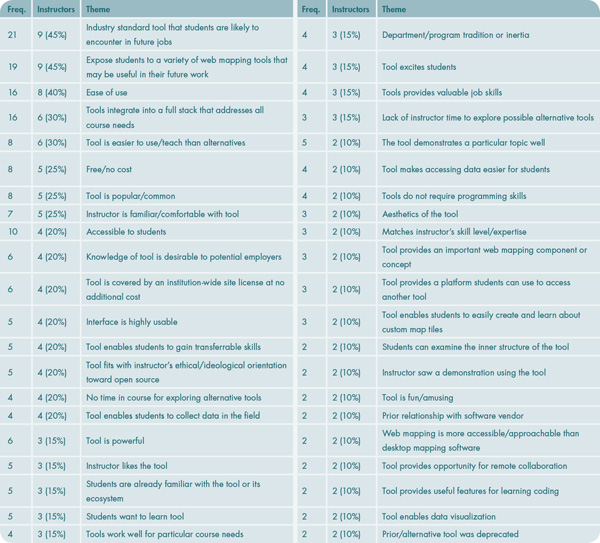
Table 6. MOTIVATION themes expressed by two or more interview participants.
Two somewhat conflicting motivations occupy the top two positions in the table, with nine participants each. These themes demonstrate the tension between providing students with experience in industry-standard Esri products and exposing students to a wide variety of alternative tools they may encounter in the future, thus encouraging adaptability. Notably, each approach sees itself as preparing students for future jobs.
Another broad, motivating theme was tool usability. Eight participants preferred using tools that are easy for both students and the instructor to figure out, and six similarly felt that the tool they chose was easier than the alternative tools they could have used. Six participants liked using tools that could integrate into a full stack of GIS technologies; this applied specifically to Esri products. Five participants each discussed tool popularity and their own familiarity with the tool.
Cost was an additional factor. Five participants expressed the need to use tools that were free, although this did not necessarily also mean open source. The cost advantage of using a tool already covered by Esri’s institutional site license was mentioned by four as a reason for choosing their tools. Interestingly, only three participants stated that the tool was chosen because it fit the needs of the existing course, and two each said that it demonstrated a particular topic or provided an important web mapping component or concept.
PEDAGOGY
The PEDAGOGY code was applied to statements about teaching philosophy, techniques, or methods used by the participant. This included but was not limited to statements using the name of a formal pedagogical model (e.g., Bloom’s Taxonomy, active learning, etc.). Table 7 lists 50 pedagogical themes expressed by two or more participants.
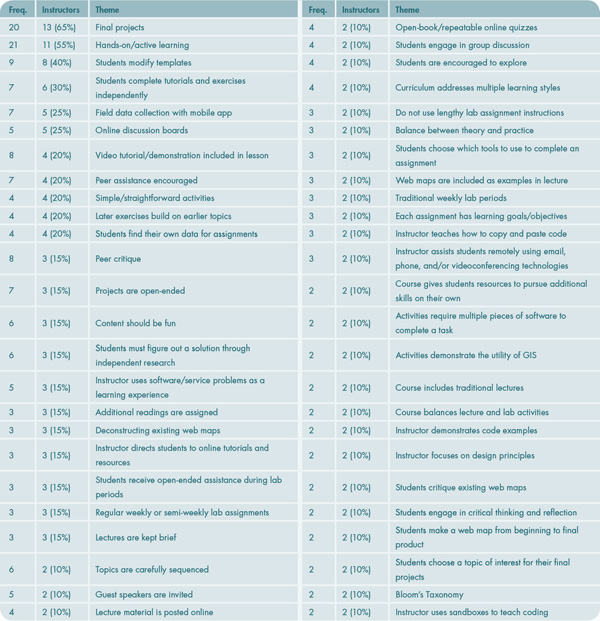
Table 7. PEDAGOGY themes expressed by two or more interview participants.
Active learning was a key pedagogical approach discussed by participants. Eleven participants directly stated that they made their assignments active and hands-on, while 13 required their students to complete an independent final project at the end of the course to apply the skills and concepts they had learned throughout the semester. It was common practice to assign students existing web map templates to customize, with eight participants employing this strategy, while six said they had students work independently on assignments during lab periods.
Real-world applications were also seen as important. A quarter of participants (5) reported using Esri’s Collector mobile app to have students collect location-tagged data outdoors on personal devices and upload that data to the ArcGIS Online platform, thereby demonstrating field data collection and processing workflows. Four participants reported requiring students to find their own data, keeping assignments relevant to their interests.
Several participants discussed different methods of content delivery through online learning management systems, used regardless of whether the class was primarily taught in person or online. These methods included hosting online discussion boards (5), generating video tutorials (4), posting lecture material online (2), and hosting open-book and repeatable online quizzes (2). Collaboration was also used frequently; multiple participants encouraged peer assistance (4) and/or integrated peer critique into project assignments (3). Several emphasized simplicity or enjoyment, including straightforward activities (4), keeping lectures brief (3), and keeping the course content fun (3).
CHALLENGE
The CHALLENGE code was applied to statements regarding what was hard or difficult about the course, for the instructor, for students, or both. Since modern web mapping technologies are both relatively new and technically complex, some challenge is to be expected. Highlighting the challenging areas may indicate where strategies should be developed for workarounds or improvements to instructional technique. Table 8 lists 31 themes, distinguishing whether each theme was primarily a challenge to the instructor, to the students, or to the course as a whole.
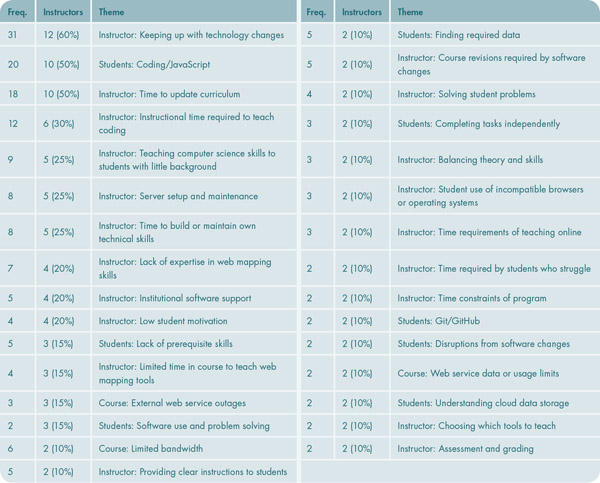
Table 8. CHALLENGE themes expressed by two or more interview participants.
Unsurprisingly, given the rapid pace of change in web mapping technologies, most instructors (12) found keeping up with those changes difficult. Many discussed the implications of rapid change as well, including finding the necessary time to update their course curriculum (10) and finding the time to maintain and build their own technology skillsets (5). Two participants mentioned specific disruptions to their planned course content caused by unforeseen software changes just before or during the time when the course was offered.
For students, according to half of participants, the most difficult aspect of web mapping to learn was coding, particularly in JavaScript. Six reported that it was difficult to find adequate time to teach coding, while five discussed the paradoxical difficulty of teaching JavaScript skills to a set of students who do not necessarily enter the course with adequate background in general computing, and three saw this as a cause of students’ difficulties learning the material. Four participants discussed their own lack of expertise in web mapping as an impediment to teaching it. Other challenges were more technical in nature, such as the difficulty of setting up and maintaining an in-house web server for the course (5), a lack of institutional support for required software (4), and outages in web services that were relied upon to teach the course (3). The latter theme particularly came up in interviews conducted after a worldwide outage of Amazon Web Services, which powers thousands of major websites and services, including the ArcGIS Online platform.
DISCUSSION
THE CURRENT STATE OF WEB MAPPING EDUCATION
The interview study revealed a great deal of variety but also some consistent patterns in course offerings. The participating instructors overwhelmingly saw web mapping as a career skill, and teaching it as necessary to prepare students for the current GIS job market. Some also viewed teaching these skills as enabling inquiry into broader critical and geographic questions. However, even those who stressed this aspect of web maps were clear on their overall purpose in teaching. One instructor exemplified their vision thusly: “By focusing on web mapping, by returning the explicit focus to spatial information and visualization . . . then we can really hone in on what makes geography and geographic thinking special, and the skills that my students have that their competitors don’t in the job market or anywhere.”
In terms of the overall scope of topics in participants’ courses, four general threads emerged: web mapping alone, web GIS, critical geography with web mapping, and web cartography. Some instructors taught courses focused on web mapping as the exclusive subject matter of the course. However, this accounted for fewer participants than anticipated. In some cases, the course was focused on GIS or web GIS, with web mapping considered a subset of the technical skills curriculum. Several other participants saw web mapping as a gateway to geographic thought, critical theory, and/or “big concepts,” in keeping with Manson et al. (2014). Finally, some introduced web mapping within traditional cartography courses, where the focus was primarily on visual design.
Enabling web technologies, data, and design ranked as the most taught topic areas. While a couple of participants included no coding at all in their web mapping courses, the majority saw a basic understanding of HTML, CSS, and JavaScript as vital, if challenging, to impart to students. Many included working with geospatial web services, which demonstrate how data layers and maps can be shared in real time across networks. However, managing the necessary server software, whether in-house or in the cloud, was frequently described as a challenge. Data—downloaded from traditional sources, collected in the field, or crowdsourced—and cartographic design are core components of web maps and were likewise key course topics.
In the market for teaching tools, Esri continues to exert dominance. While some interview questions were intended to prompt participants to reflect on the difference between open source and proprietary software and why they would use one over the other, most participants’ answers showed this to be an amorphous divide. By far the more relevant division was between Esri and non-Esri software. Participants highlighted the need for tools to be free, easy to use and teach, and relevant to students’ future jobs; for most, the type of software license was of minor or no concern.
Esri’s ArcGIS Online platform provides a full suite of scalable tools and applications that cover virtually every component of web mapping architecture. At its basic, free tier, the software includes a hosted web mapping service with an accessible graphic interface. For client-side development, Esri provides an open-source JavaScript API, easy-to-modify application templates, and open access to many of its web services for non-profit use. Subscriptions to more advanced spatial analysis, data collection, and hosting capabilities are fully covered by the vendor’s educational site licensing and thus entail no cost to instructors. Esri’s desktop software, used in almost every introductory GIS course, is increasingly integrated with its online platform. Instructors stressed convenience, good documentation, vertically integrated applications, and absence of any additional cost as reasons for sticking with Esri, in addition to the vendor’s continued dominance in the industry.
Nonetheless, there are downsides to Esri software that led some participants to consider other options. ArcGIS Server was frequently highlighted as difficult to set up and maintain. While templates are available for beginners to modify, the Esri JavaScript API is more complex than some open source mapping APIs. Some participants disparaged the lack of cartographic design guidance in ArcGIS Online. A couple rejected Esri software out of ideological adherence to free and open source. But the most frequently stated reason for using non-Esri software was simply to expose students to a wide variety of web mapping tools that they might encounter in the workplace. “I don’t want [students] to know about just one thing, or one set of tools,” opined one participant, “I want them to know about all kinds of tools out there, so they can be well equipped for whatever job position they happen to be going into.”
In terms of pedagogy, hands-on active learning was seen as critical to student success. Several participants expected students to come up with their own data, or otherwise tried to make the learning relevant to students’ interests. These are basic principles of constructivism, the philosophy that the role of the instructor is to assist students in building their own knowledge structures around the material (Foote 2012). They seem obvious in the case of a technical skillset such as web mapping, which operates at the uppermost, “create” level of Bloom’s cognitive taxonomy, requiring students to synthesize concepts to produce an application (Anderson and Krathwohl 2001). Most instructors provided an exercise in creation via an end-of-term final project. What was not as expected was the prevalence of certain teaching techniques enabled by online learning management tools, such as hosting ongoing discussion boards and posting written and video tutorials for students to review. In particular, some participants commented on finding unanticipated benefits to posting lecture material and demonstrations online, such as increased comprehension among students for whom English is a second language, and the ability of all students to review the material and uptake concepts they may have missed during the class session.
The two greatest challenges in teaching web mapping were, unsurprisingly, teaching students how to code and keeping up with rapid technology changes in the industry. Most participants’ courses are offered by a geography department or closely related discipline, so few students come to them with advanced computer science skills or programming experience (with some exceptions). There seemed to be consensus among participants that a single term is simply not enough time to turn beginners into coders at a higher than cursory level. Nonetheless, while a couple of participants avoided teaching any code, most considered basic knowledge of web languages important, even in courses with a broader scope such as web GIS. Several participants asked students to modify existing templates as an approachable way to learn some basic web development concepts.
With the available teaching tools changing quickly, many participants struggled to find time to update course materials as well as their own tool awareness and skillsets given other teaching and research commitments. Most software vendors and open-source projects will continue to support older versions after a new release, but those instructors who chose to use more innovative or cutting-edge products sometimes found themselves faced with acute disruption when a vendor chose to discontinue development of the selected tool. Further, the growing importance of interconnected cloud services may have promoted a false sense of security, as even the most trusted e-services were proven vulnerable to technical failure during the time period when interviews were conducted. Several participants had their courses disrupted on February 28, 2017, when Amazon Web Services—which hosts ArcGIS Online—suffered a major outage caused by human error, knocking those tools offline (Del Rey 2017). Taken together, these factors require web mapping instructors to be nimble and adaptable to change, while also maintaining technology blog subscriptions and attending technical conferences.
RECOMMENDATIONS FOR TEACHING WEB MAPPING
Based on the interview study results discussed above, it is clear that there are a variety of ways of integrating web mapping into geography, cartography, and GIS programs of study, and that the ultimate goal of each is to integrate spatial thinking with computational thinking and technical skills. The GIScience and Technology Body of Knowledge entry on Web Mapping (Sack 2017) lists ten learning objectives, which are organized according to the revised Bloom’s Cognitive Taxonomy (Anderson and Krathwohl 2001; Table 9). These objectives were informed partly by the research I report here as well as prior research into web mapping course development (Sack and Roth 2017). All ten objectives should be included in new courses with a focus on web mapping, while critical geography, cartography, and GIS courses may choose a subset to integrate.
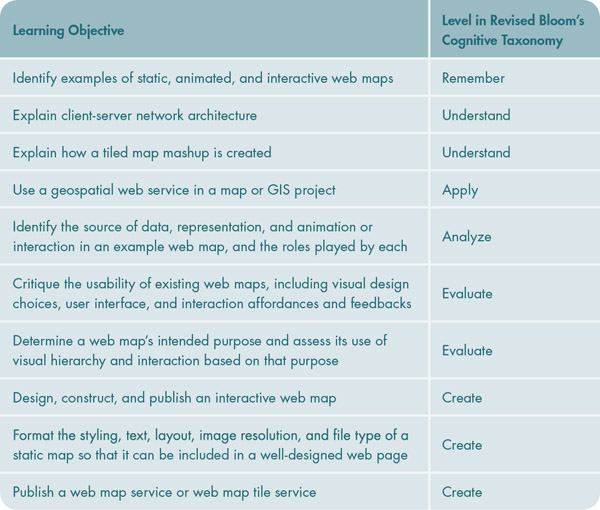
Table 9. Web Mapping Learning Objectives from the GIS&T Body of Knowledge entry on Web Mapping, organized according to Bloom’s Cognitive Taxonomy.
The learning objectives in Table 9 form a measurable baseline of skills that students in web mapping courses should have at the end of the course. This sample is not intended as a comprehensive list of all possible learning objectives for web mapping and operates at the scope rather than the topical level of abstraction. Web mapping instructors should develop additional topical learning objectives that contribute to student success in this overall skill set. The depth of the curriculum depends on the course scope; broader-scope courses necessarily will not be able to accomplish as many web mapping objectives. A professional-level mastery of these skills will require multiple semesters of integrated coursework.
The pedagogy best suited to achieving these learning objectives is rooted in constructivism. There is little dispute in the literature and in the study results that active learning focused on real-world problems and applications is key to student success with web mapping. The constructivist principle of scaffolding and the open source principle of innovation based on manipulation of prior work can guide the assignment of learning activities, such as modifying existing web map templates (Schultz 2012; Balter 2015). Online learning management systems and robust web-based collaboration tools should be employed as central features of the coursework, not left out or treated as an afterthought. These tools reinforce both metacognition and collaborative troubleshooting skills that are essential to web development.
Support at the program and institutional levels is essential to the successful implementation of web mapping coursework. Information technology (IT) support staff must be willing to collaborate with instructors on making both client- and server-side web mapping tools available to students while maintaining network security. Before teaching a web mapping course, instructors should thoroughly plan what technologies will be needed and check with IT staff on the amount of notice required to install the software on institutional machines and what level of support can be provided during the course. Depending on the institution, instructors may need to be prepared to find creative workarounds involving cloud-hosted services if a desired tool cannot be made available to students. The choice of specific technologies used to achieve the web mapping objectives is much less important than emphasizing the adaptability and transferability of the design and development concepts involved in web mapping.
Given the pace of technology change, instructors must also make the case to their administrative and supervisory personnel for release time and funding to enable professional development and curriculum development. Given the rapidly growing importance of programming and web development skills to STEM careers, institutions and programs that wish to produce successful graduates must give instructional faculty the resources they need to develop these skills themselves and integrate them into cartography and GIS curricula.
CONCLUSION
Web mapping and coding skills are vital within the cartography and GIS career fields. Yet academic web mapping instruction remains in the pioneering phase, with relatively few institutions offering it in some form. Those that do offer it use a range of approaches that vary by scope of subject matter and depth of skills taught. Some instructors teach web mapping as a stand-alone subject, while others embed it within a broader context of GIScience, cartography, or critical geography theory. The former courses tend to go deeper into the technical skills, including a heavy emphasis on JavaScript coding, while the latter tend to include coding as a minor component or not at all due to the time requirements and lack of prerequisite skills in students. There are some exceptions to this trend, such as one interview participant who focuses heavily on technical skills but works in critique of the ontologies of geographic information and geospatial technology.
The newness of the field, the rapid pace of technology change, and the lack of prior experience with computer programming among the current generation of students pose major challenges for instructors of web mapping courses. Institutions have a major role to play in supporting the development of such courses, and given the demand for web mapping skills, it is in their interest to do so. Administrators can support instructors by lightening teaching loads to allow time for research, development, and updating of course materials, as well as providing funds for conferences and workshops. IT staff can help by dedicating time to working with instructors to install and configure necessary software, and by reducing lead time for new software requests as much as possible.
Despite the challenges, the participants interviewed for this study demonstrate that web mapping instruction is possible in a wide range of higher education settings given minimal instructor knowledge of the technology and a willingness to experiment. Web maps are no longer the maps of tomorrow; they are the maps of today. Training in web mapping technologies should be considered mandatory for future cartographers. The strategies exposed by this study should serve as inspiration for cartography and GIScience educators everywhere to develop courses that provide their students with these essential skills.
REFERENCES
Abrahams, David A. 2010. “Technology Adoption in Higher Education: A Framework for Identifying and Prioritising Issues and Barriers to Adoption of Instructional Technology.” Journal of Applied Research in Higher Education 2 (2): 34–49. doi: 10.1108/17581184201000012.
Adams Becker, S., M. Cummins, A. Davis, A. Freeman, C. Hall Giesinger, and V. Ananthanarayanan. 2017. NMC Horizon Report: 2017 Higher Education Edition. The New Media Consortium. Accessed November 25, 2017. http://cdn.nmc.org/media/2017-nmc-horizon-report-he-EN.pdf.
Adobe Corporate Communications. 2015. “Flash, HTML5 and Open Web Standards.” Adobe Blog. Accessed March 10, 2017. https://blogs.adobe.com/conversations/2015/11/flash-html5-and-open-web-standards.html.
Anderson, Lorin W. and David R. Krathwohl. 2001. A Taxonomy for Learning, Teaching, and Assessing: A Revision of Bloom’s Taxonomy of Educational Objectives. New York: Longman.
Atkinson, Rob. 2016. “Technology May Disrupt Occupations, But it Won’t Kill Jobs.” Monthly Labor Review. February 26, 2016. doi: 10.21916/mlr.2016.8.
Balter, Ben. 2015. “6 Motivations for Consuming or Publishing Open Source Software.” Opensource.org. December 9, 2015. Accessed February 25, 2018. https://opensource.com/life/15/12/why-open-source.
Bowlick, Forrest J., Daniel W. Goldberg, and Sarah W. Bednarz. 2017. “Computer Science and Programming Courses in Geography Departments in the United States.” The Professional Geographer 69 (1): 138–150. doi: 10.1080/00330124.2016.1184984.
Bozkurt, Aras, Ela Akgun-Ozbek, Sibel Yilmazel, Erdem Erdogdu, Hasan Ucar, Emel Guler, Sezan Sezgin, et al. 2015. “Trends in Distance Education Research: A Content Analysis of Journals 2009-2013.” International Review of Research in Open and Distributed Learning 16 (1): 330–363. doi: 10.19173/irrodl.v16i1.1953.
Built With. 2017. “Google Maps Usage Statistics.” Built With. Accessed June 8, 2017. https://trends.builtwith.com/mapping/Google-Maps.
Crampton, Jeremy. 2010. Mapping: A Critical Introduction to Cartography and GIS. Chichester, UK: Wiley-Blackwell.
Davidson, Paul, and Paul Soubry. 2014. “What Do Employers Want from Canadian Higher Education?” Universities Canada News. June 18, 2014. Accessed February 11, 2018. https://www.univcan.ca/media-room/media-releases/what-do-employers-want-from-canadian-higher-education.
Del Rey, Jason. 2017. “Amazon’s Massive AWS Outage Was Caused by Human Error.” recode. March 2, 2017. Accessed November 9, 2017. https://www.recode.net/2017/3/2/14792636/amazon-aws-internet-outage-cause-human-error-incorrect-command.
Fain, Paul. 2017. “Better Marriage Between College and Job Training.” Inside Higher Ed. March 22, 2017. Accessed February 11, 2018. https://www.insidehighered.com/news/2017/03/22/ideas-improving-higher-educations-primary-role-work-force-development.
Foote, Kenneth E. 2012. “Scope and Sequence in GIS&T Education: Learning Theory, Learning Cycles, and Spiral Curricula.” In Teaching Geographic Information Science and Technology in Higher Education, edited by David J. Unwin, Kenneth E. Foote, Nicholas J. Tate, and David DiBiase, 81–95. West Sussex, UK: Wiley-Blackwell. doi: 10.1002/9781119950592.ch6.
Hallgren, Kevin A. 2012. “Computing Inter-Rater Reliability for Observational Data: An Overview and Tutorial.” Tutorials in Quantitative Methods for Psychology 8 (1): 23–34. doi: 10.20982/tqmp.08.1.p023.
Hermansen, Sally. 2010. “Teaching Cartography in Academia: A Historical Reflection and Discussion of a 2007 Survey of Canadian Universities.” Cartographica 45 (1): 5–18. doi: 10.3138/carto.45.1.5.
Jenny, Bernhard, Helen Jenny, and Stefan Räber. 2008 “Map Design for the Internet.” In International Perspectives on Maps and the Internet, edited by Michael P. Peterson. 31–48. Berlin & Heidelberg: Springer-Verlag. doi: 10.1007/978-3-540-72029-4_3.
Jesdanun, Anick. 2015. “Apple Maps, Once a Laughingstock, Now Dominates iPhones.” Associated Press, December 7, 2015. Accessed April 25, 2016. http://bigstory.ap.org/article/df90458e58564f19b4b7c8510f9baa67/apple-maps-once-laughingstock-now-dominates-iphones.
Jobs, Steve. 2010. “Thoughts on Flash.” Apple Hotnews. Accessed August 20, 2015. http://www.apple.com/hotnews/thoughts-on-flash.
Kerski, Joseph J., Andrew J. Milson, and Ali Demirci. 2012. “Synthesis: The Future Landscape of GIS in Secondary Education.” In International Perspectives on Teaching and Learning with GIS in Secondary Schools, edited by Andrew J. Milson, Ali Demirci, and Joseph J. Kerski, 315–326. Dordrecht, Germany: Springer Science+Business Media. doi: 10.1007/978-94-007-2120-3_35.
Lienert, Christophe, Bernhard Jenny, Olaf Schnabel, and Lorenz Hurni. 2012. “Current Trends in Vector-Based Internet Mapping: A Technical Review.” In Online Maps with APIs and Web Services, edited by Michael P. Peterson, 23–36. Berlin & Heidelberg: Springer-Verlag. doi: 10.1007/978-3-642-27485-5_3.
Lund, Bob. 2017. “W3C Recommendation: Plugin-Free Playback of Premium Content.” INFORM[ED] by CableLabs October 17, 2017. Accessed October 29, 2017. https://www.cablelabs.com/w3c-recommendation-plugin-free-playback-of-premium-content.
Luo, Heng, Anthony C. Robinson, and Jim Detwiler. 2014. “Effect of Geographic Distance on Distance Education: An Empirical Study.” Journal of Educators Online 11 (3). doi: 10.9743/JEO.2014.3.1.
Manson, Steven, Jerry Shannon, Sami Eria, Len Kne, Kevin Dyke, Sara Nelson, Lalit Batra, et al. 2014. “Resource Needs and Pedagogical Value of Web Mapping for Spatial Thinking.” Journal of Geography 113 (3): 107–117. doi: 10.1080/00221341.2013.790915.
Miles, Matthew B., A. Michael Huberman, and Johnny Saldaña. 2014. Qualitative Data Analysis: A Methods Sourcebook, 3rd ed. Thousand Oaks, CA: SAGE Publications, Inc.
Moser, Franziska Z. 2007. “Faculty Adoption of Educational Technology.” Educause Quarterly 30: 66–69.
Muehlenhaus, Ian. 2014. Web Cartography: Map Design for Interactive and Mobile Devices. Boca Raton, Florida: CRC Press.
Nielsen, Jakob. 2016. “Nielsen’s Law of Internet Bandwidth.” Nielsen Norman Group. Accessed June 8, 2017. https://www.nngroup.com/articles/law-of-bandwidth.
Peterson, Michael P. 2008. “International Perspectives on Maps and the Internet: An Introduction.” In International Perspectives on Maps and the Internet edited by Michael P. Peterson, 3–10. Berlin & Heidelberg: Springer-Verlag. doi: 10.1007/978-3-540-72029-4_1.
———. 2012. “The Tile-Based Mapping Transition in Cartography.” In Maps for the Future: Children, Education and Internet edited by László Zentai and Jesús Reyes Nunez, 151–163. Berlin & Heidelberg: Springer-Verlag. doi: 10.1007-978-3-642-19522-8_13.
———. 2014. Mapping in the Cloud. New York and London: The Guilford Press.
Robinson, Anthony C., and Jonathan K. Nelson. 2015. “Evaluating Maps in a Massive Open Online Course.” Cartographic Perspectives 80: 6–17. doi: 10.14714/CP80.1299.
Roth, Robert E., Richard G. Donohue, Carl M. Sack, Timothy R. Wallace, and Tanya M. A. Buckingham. 2014. “A Process for Keeping Pace with Evolving Web Mapping Technologies.” Cartographic Perspectives 78: 25–52. doi: 10.14714/CP78.1273.
Sack, Carl. 2017. “Web Mapping.” The Geographic Information Science and Technology Body of Knowledge, edited by John P. Wilson. University Consortium for Geographic Information Science. doi: 10.22224/gistbok/2017.4.11.
Sack, Carl M., and Robert E. Roth. 2017. “Design and Evaluation of an Open Web Platform Cartography Lab Curriculum.” Journal of Geography in Higher Education 41 (1): 1–23. doi: 10.1080/03098265.2016.1241987.
Schultz, Richard B. 2012. “Active Pedagogy Leading to Deeper Learning: Fostering Metacognition and Infusing Active Learning Into the GIS&T Classroom.” In Teaching Geographic Information Science and Technology in Higher Education, edited by David J. Unwin, Kenneth E. Foote, Nicholas J. Tate, and David DiBiase, 133–143. West Sussex, UK: Wiley-Blackwell. doi: 10.1002/9781119950592.ch9.
Seaman, Julia E., Elaine I. Allen, and Jeff Seaman. 2018. Grade Increase: Tracking Distance Education in the United States. Babson Survey Research Group. Accessed April 11, 2018. http://onlinelearningsurvey.com/reports/gradeincrease.pdf.
UCGIS. 2017. GIS&T Body of Knowledge. University Consortium for Geographic Information Science. Accessed on June 8, 2017. http://gistbok.ucgis.org.
UW–Madison. 2017. “About the Online Master’s Program in GIS & Web Map Programming.” University of Wisconsin–Madison. Accessed June 13, 2017. https://geography.wisc.edu/gis/professional-masters/about-the-online-masters-program.